

If you want to check Google Trends for a few keywords, it’s a straightforward process. Things get more repetitive when you need to compare multiple regions, time periods, or categories, which is where a scraper can help automate the data collection.
In this guide, we show how to automate data collection from Google Trends using a Python scraper. We examine the options available for scraping data from Google Trends and provide step-by-step instructions for building your own scraper in Python. We also discuss the important role proxies play in this process.
What Is a Google Trends Scraper and How Does It Work?
A Google Trends scraper is a script or service that automatically collects data from Google Trends. It works by taking in parameters such as keywords or topics, location, timeframe, category, and search type, and outputting the collected information in a usable format.
Scrapers can gather several types of data, including but not limited to: interest over time; regional interest; related queries, topics, and searches; and trending data.
Google Trends has a number of restrictions; one of the primary ones is that you can't choose to see the actual volume of searches, only the relative value. One other caveat to consider: This tool distinguishes between “search terms” and “topics.”
Each data point is divided by the total number of searches for its location and time range and scaled on a range of 0 to 100 (with 100 representing peak relative interest within the selected comparison period). When you enter a search term, it will try to match it to an exact match of the words you entered, so typing in ‘football' will not include ‘soccer'. Topics are more general and consider variations, misspellings, and translations. For instance, when you type in the topic “football,” it would also show “soccer.”
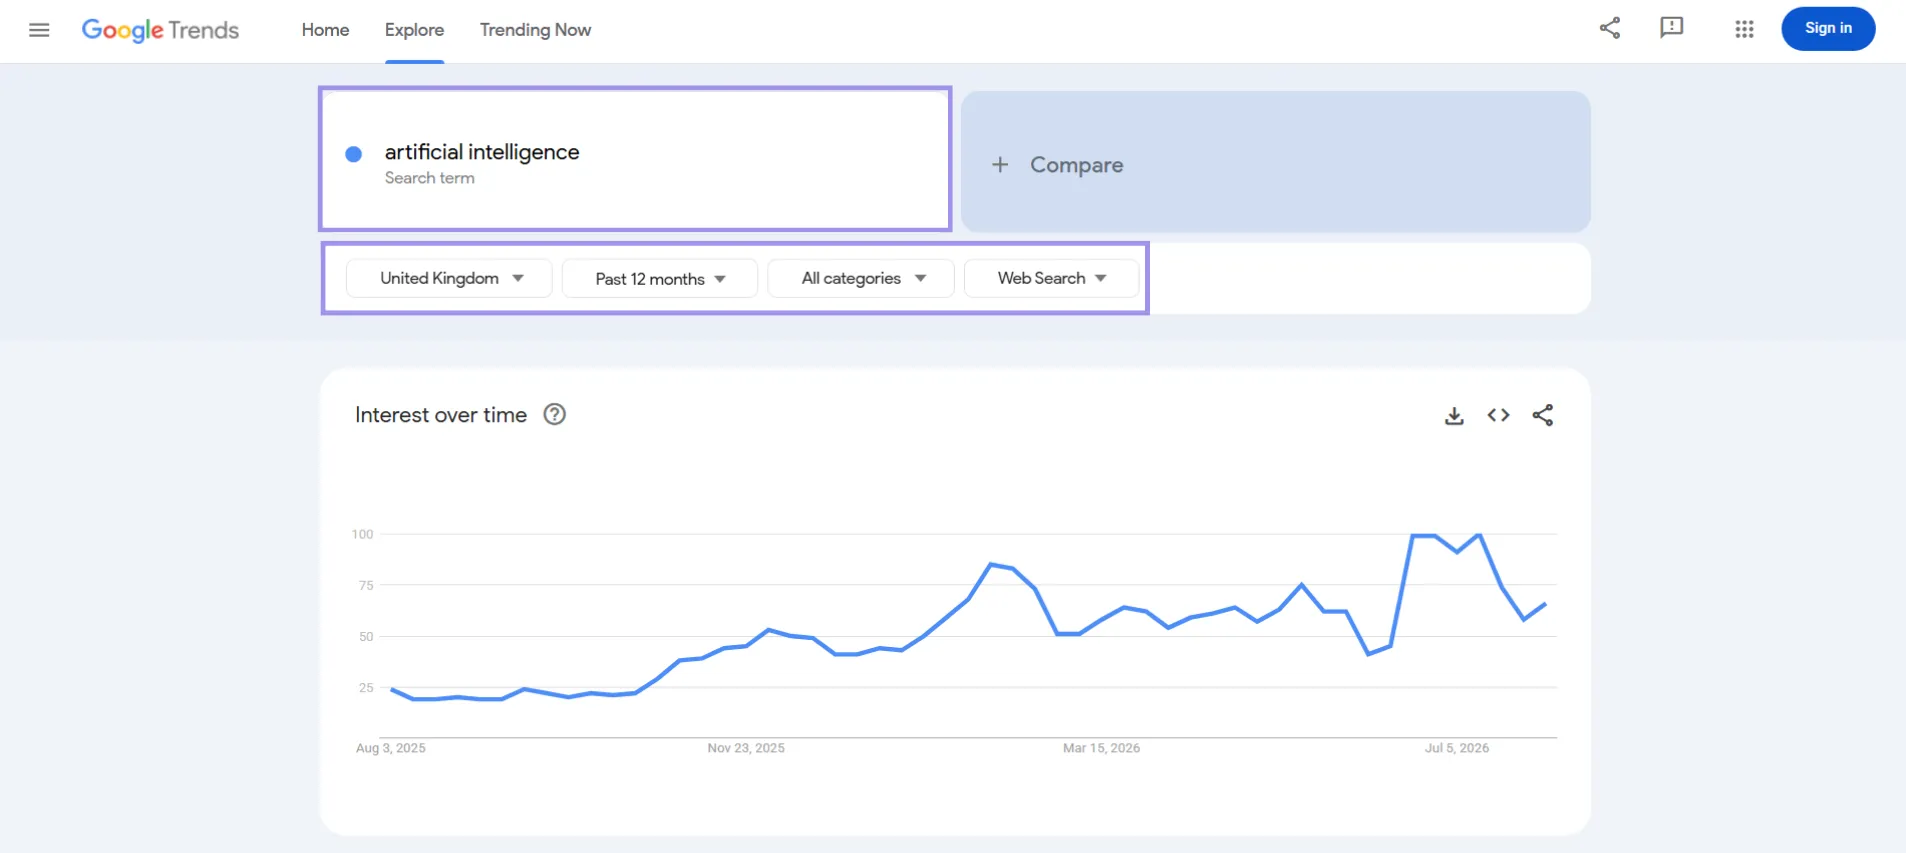
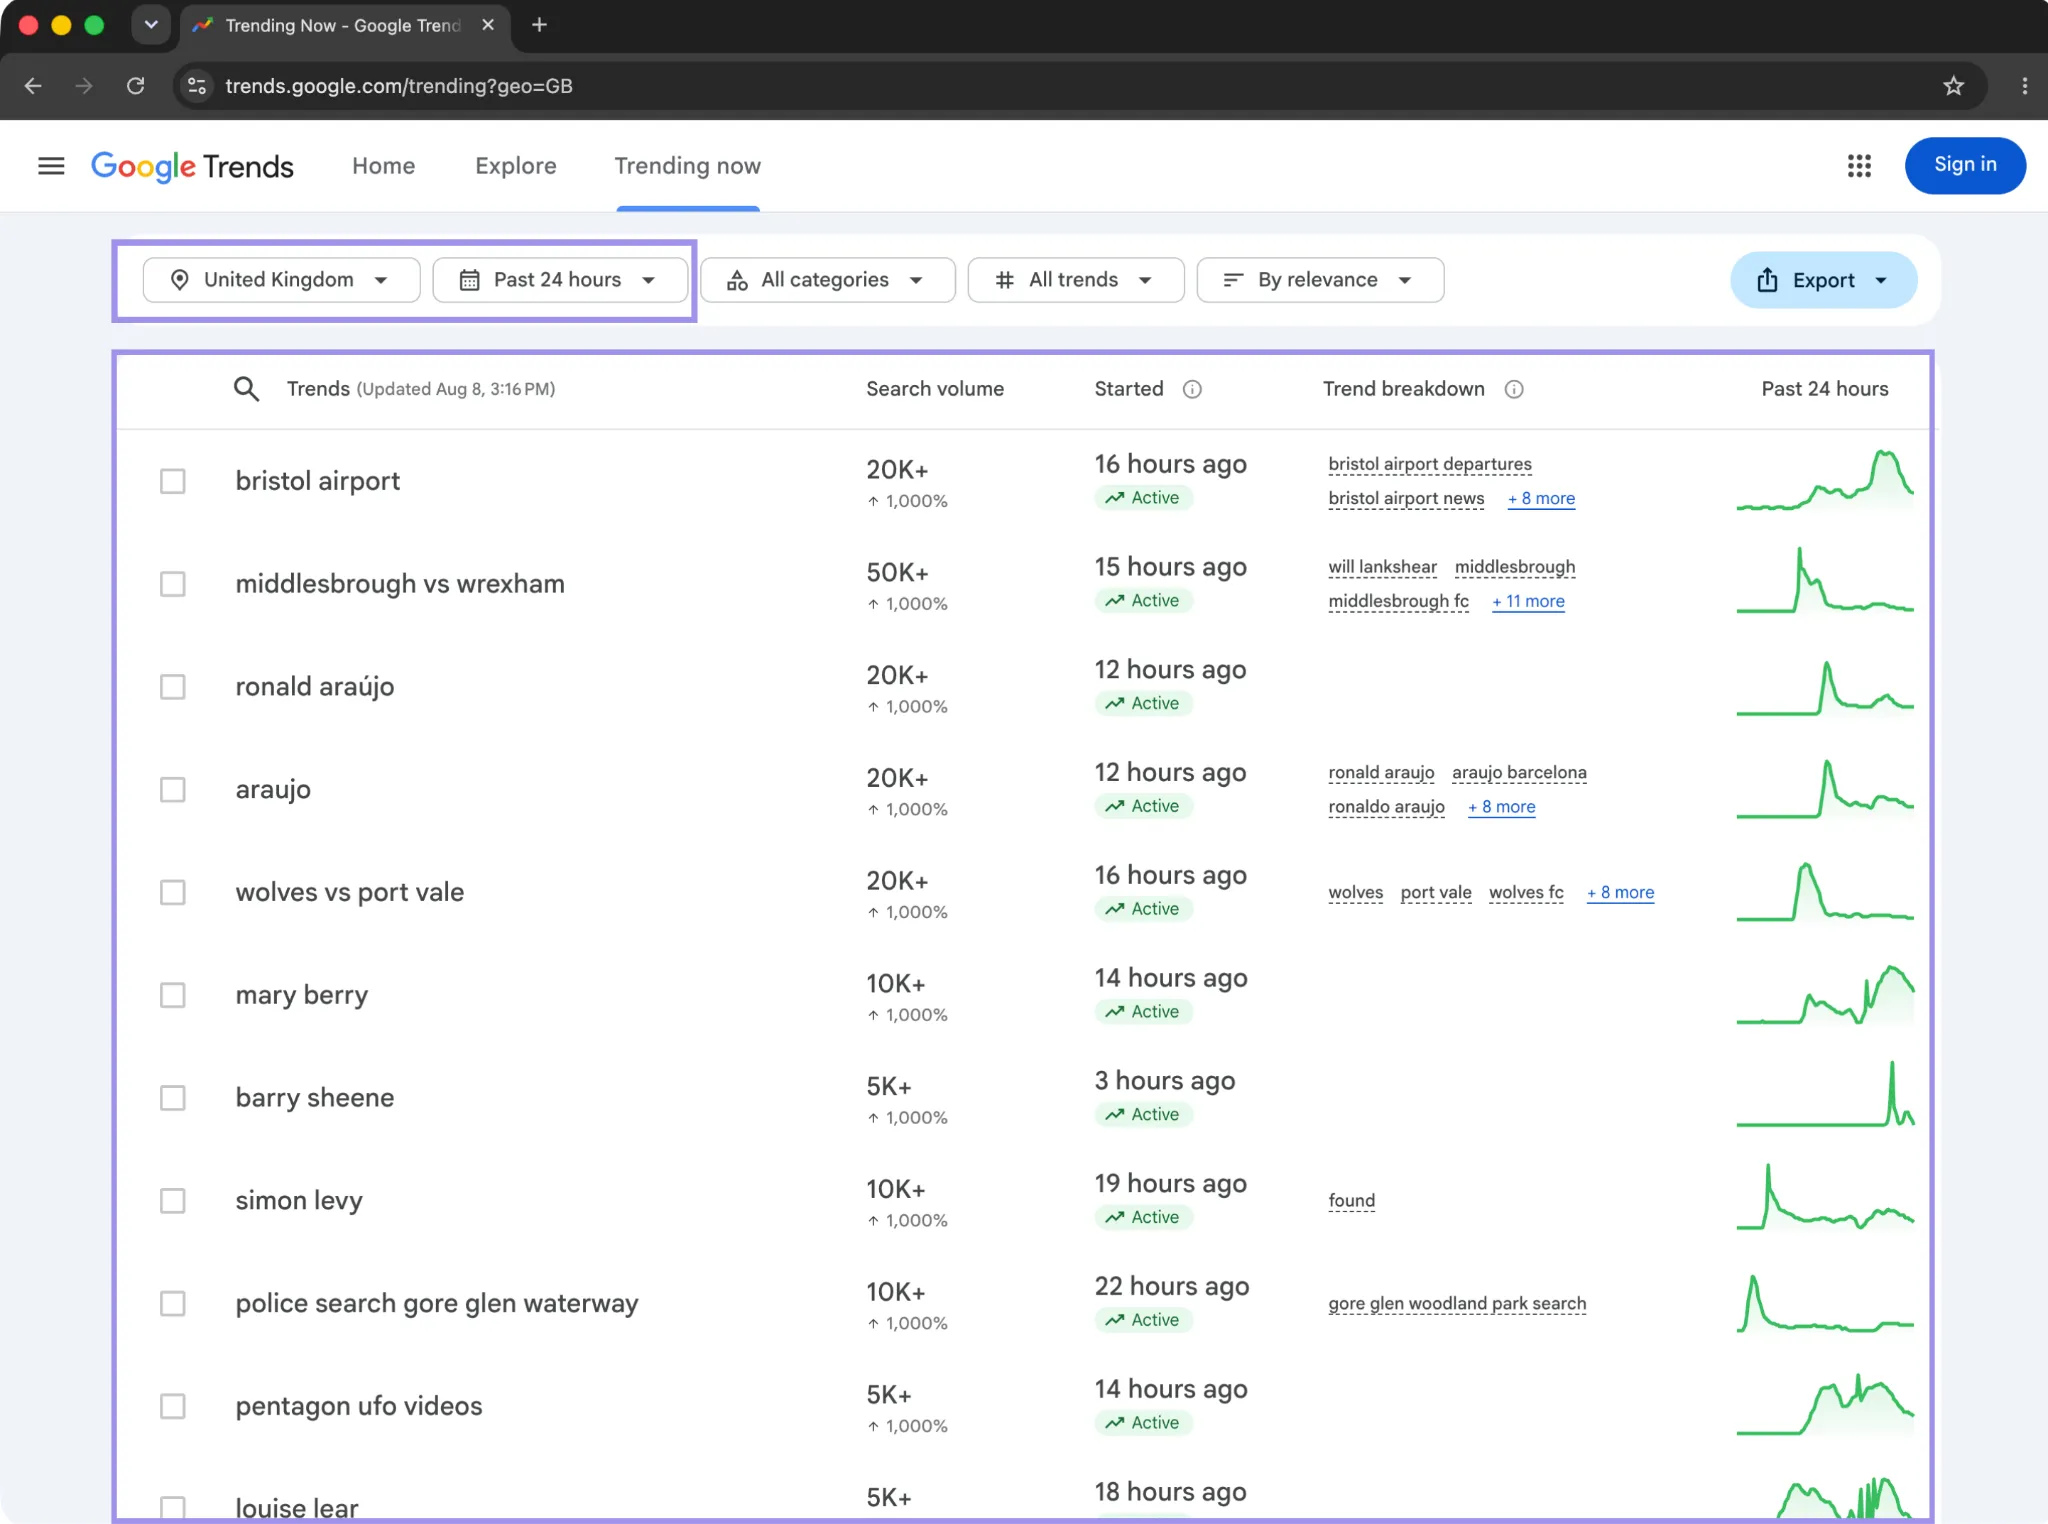
Google Trends comes with two main sections to view data: “Trending Now” and “Explore.” The information is displayed in an HTML table on the Trending Now page, and charts and widgets are dynamically loaded after the page has loaded on the Explore page.
Trending Now is easier to extract from: wait for the table to appear, then read its contents directly. In contrast, getting data from Explore is a little trickier as there may be a delay between when the page loads and when all its components have been fully rendered. As such, this guide will focus primarily on using the Trending Now feature and testing Explore separately later in the guide.
Why Scrape Google Trends?
Automating data collection is only worth it when you need to collect the same data repeatedly. There are a bunch of scenarios where web scraping can be helpful:
- SEO and keyword research: comparing relative interest across keywords before committing to a content plan.
- Content planning: Finding out what topics are going up or down in relation to a publishing schedule.
- Market research: Tracking how interest in a product category shifts between regions.
- Seasonal demand: Recognizing the seasonal patterns all year long and arranging the campaigns accordingly.
- Brand and product monitoring: Following interest over a consistent timeframe instead of ad-hoc checks.
There are many ways of doing this, depending on how often you need the information and how much control you wish to have over the process.
Ways to Collect Google Trends Data
Depending on the frequency of your data requirements and the level of control needed over your workflow, there are several ways you can approach this task. You can export data manually, use Python libraries, or automate the process in a web browser.
| Method | Best for | Limitation |
|---|---|---|
| Manual export | Small research tasks | Becomes repetitive |
| Python libraries | Experiments and prototypes | Can require maintenance |
| Browser automation | Custom repeatable workflows | Needs more setup |
| APIs | Application-based access | Availability may be limited |
| Managed solutions | Teams scaling collection | Added cost |
Manual exports and Python libraries are great if you only need data occasionally or don't want to spend too much time setting up a system. However, before you use a Python library, be sure it is still being developed and supported by the library's creators, as many are no longer.
There are tools available that were popular but no longer maintained, such as Pytrends (no longer maintained on the original GitHub repository and is read-only), which we don't recommend creating recurring workflows based on.
Google has an alpha version of a Trends API. It offers a rolling 5 years of data, daily, weekly, monthly, and yearly aggregation, region and sub-region data, and consistently scaled values for comparison across requests. Google also claims the API allows you to compare dozens of terms, whereas the Trends UI allows for only eight terms to be compared. Access is still restricted to approved alpha testers.
There is also an aggregated top and rising query dataset published through BigQuery without the approval step.
The downside of browser automation is that it is more complicated, but it offers greater control in the process of loading the pages, what data to pull off, and how to validate the results; hence the choice of this approach for our guide.
Build a Google Trends Scraper With Python
We will begin by developing a basic “Trending Now” scraper that will utilize a standard Internet connection. This script will read the UK report, wait for the results table to appear, and run a loop to get the data from the visible fields. It will save this information in CSV and JSON files. If this works, then we'll be incorporating the proxy.
What you need before building
Before you start, have:
- Python version 3.10 or above is recommended for the current packages to be compatible.
- Query settings: The region and timeframe you want to collect.
- Output folder: A folder will be created for the output of the CSV and JSON files automatically.
To begin, open the report manually in your browser. Check that the region, timeframe, and other parameters are set correctly, and that you get the expected results. This is important as it will be your baseline, the report you see before automating anything.
Install Playwright and Chromium
Run:
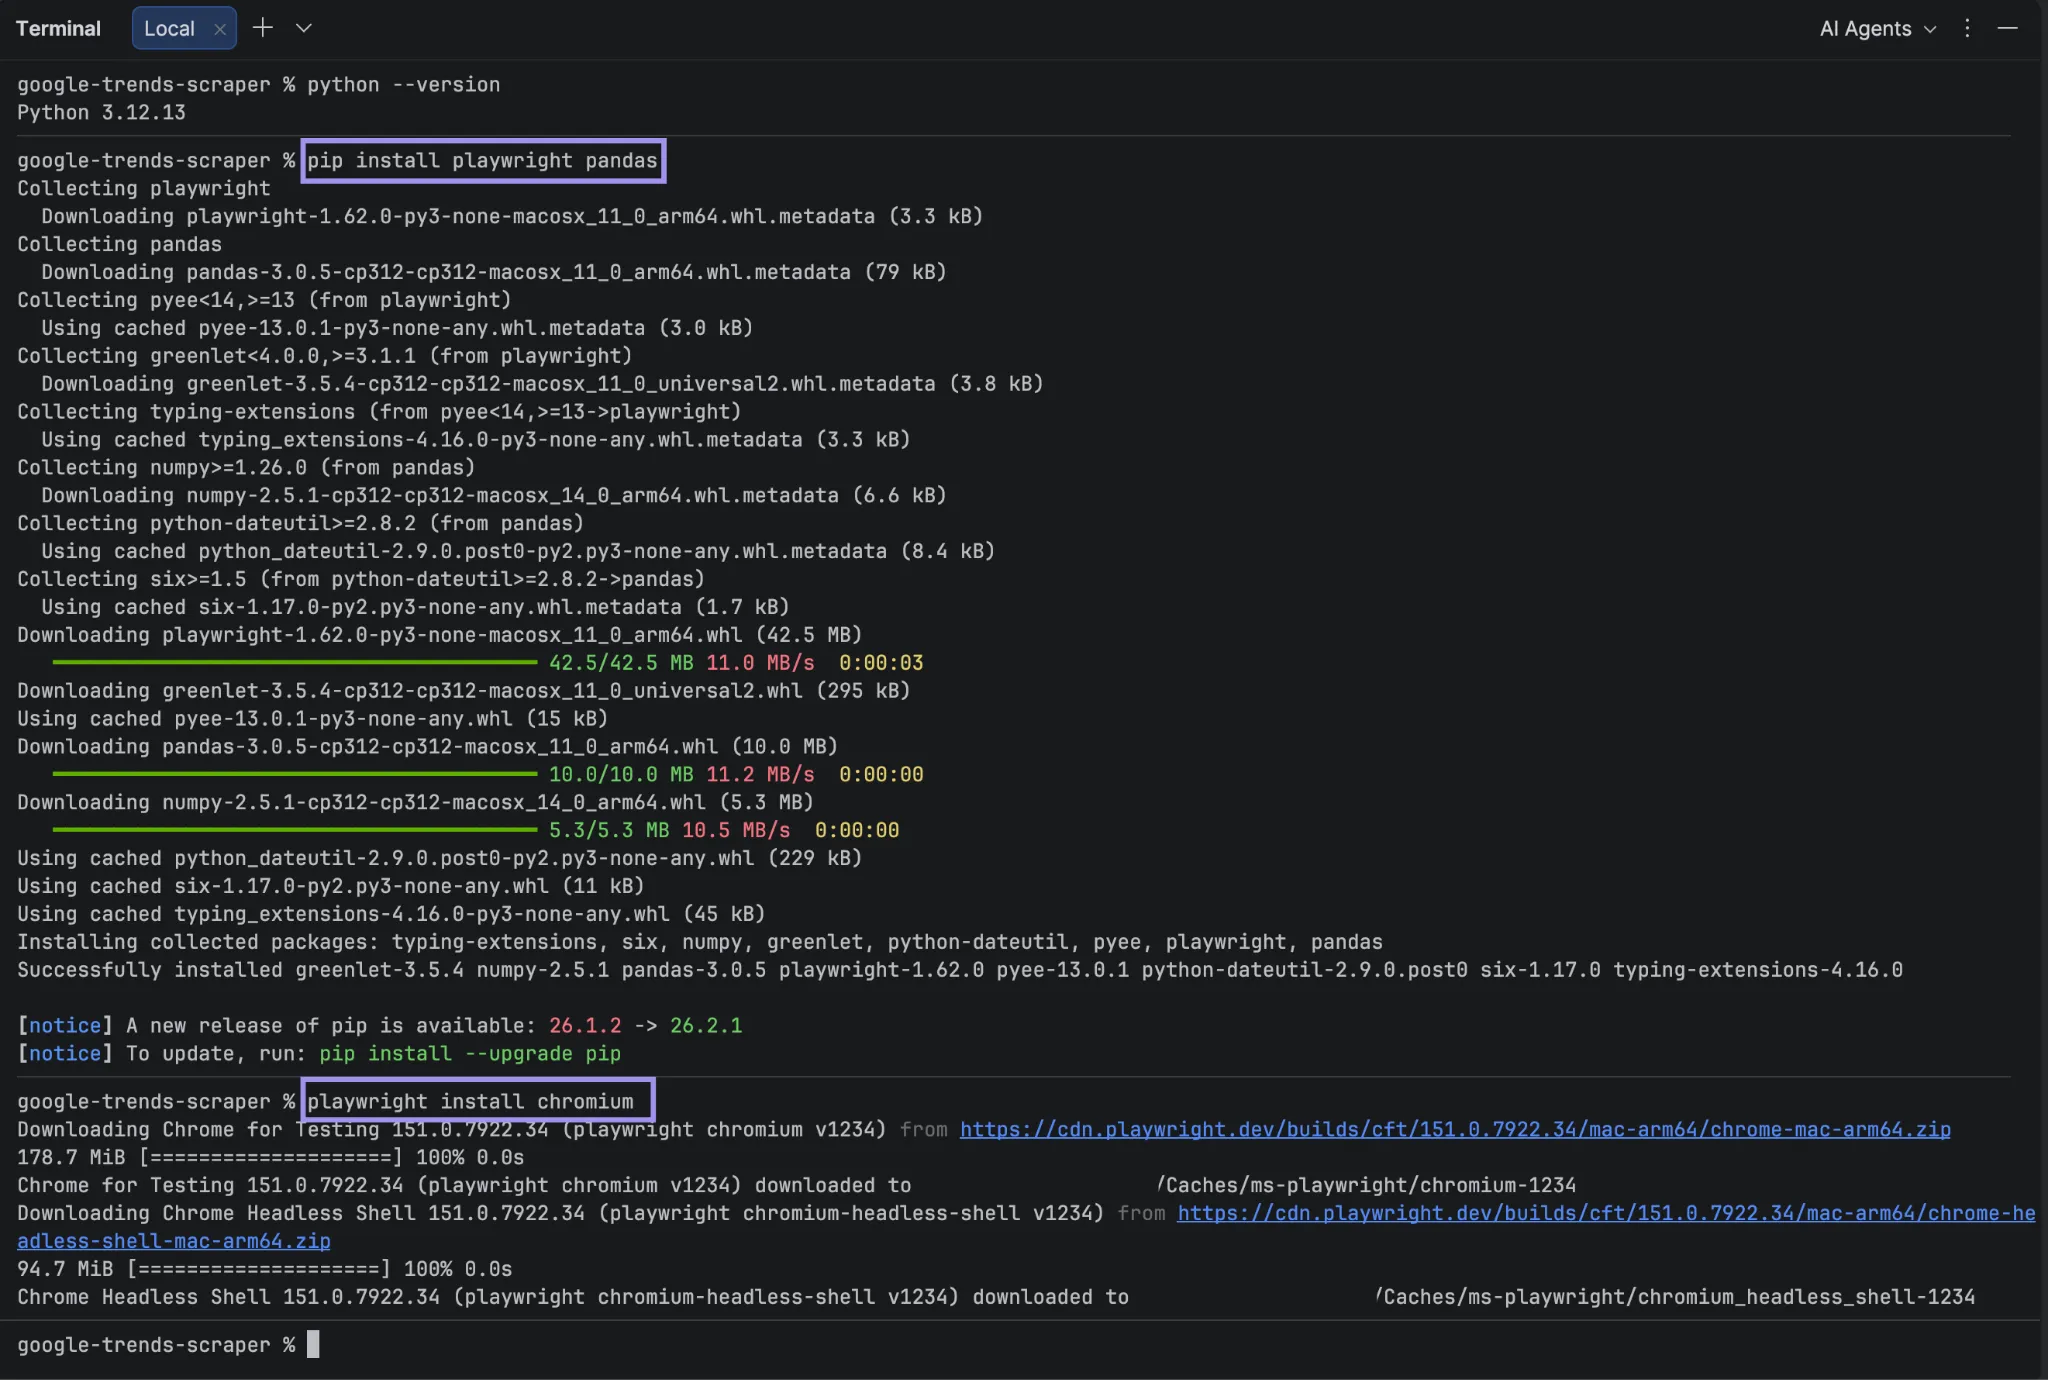
 pip install playwright pandas
playwright install chromium
The first command installs some Python packages. The second fetches Chromium, the browser that Playwright will control.
Configure and load Google Trends
We are going to scrape the UK “Trending Now” page, which shows what has been most popular over the last 24 hours.
import json
import os
from datetime import datetime, timezone
import pandas as pd
from playwright.sync_api import sync_playwright
GEO = "GB"
HOURS = "24"
HOME_URL = "https://trends.google.com/"
TRENDING_URL = f"https://trends.google.com/trending?geo={GEO}&hours={HOURS}"
By setting GEO and HOURS at the top, we can easily change these values later without modifying the script's main extraction logic.
Next, launch Chromium and load the page:
with sync_playwright() as playwright:
        browser = playwright.chromium.launch(headless=False)
        page = browser.new_page(
            viewport={"width": 1440, "height": 900}
        )
        page.goto(HOME_URL, timeout=45000)
        if "consent.google.com" in page.url:
            for button_text in ["Accept all", "I agree"]:
                button = page.get_by_role("button", name=button_text)
                if button.count() > 0:
                    button.first.click()
                    break
        response = page.goto(
            TRENDING_URL,
            timeout=45000
        )
        print("HTTP status:", response.status)
Opening the homepage first allows the browser to take care of Google's consent page before the “Trending Now” section loads. We received an HTTP 200 response from the page during both headless and headed tests.
Extract the visible trend rows
When our DOM check sees rows that meet the “table tbody tr[data-row-id]” selector, it will pause and wait for those rows to appear.
Add this before closing the browser:
        selector = "table tbody tr[data-row-id]"
        page.wait_for_selector(
            selector,
            timeout=15000
        )
        rows = page.locator(selector)
        trends = []
        for index in range(rows.count()):
            cells = rows.nth(index).locator("td")
            trends.append({
                "title": cells.nth(1).inner_text().strip(),
                "search_volume": cells.nth(2).inner_text().strip(),
                "started": cells.nth(3).inner_text().strip(),
                "breakdown": cells.nth(4).inner_text().strip(),
            })
        print("Rows found:", len(trends))
This keeps the example simple, reading only the cells that matter rather than parsing every element on the page.
Save the output
Finally, save the collected rows so you can inspect or process them later:
        os.makedirs("output", exist_ok=True)

        timestamp = datetime.now(
            timezone.utc
        ).strftime("%Y%m%dT%H%M%SZ")

        csv_path = f"output/trending_{GEO}_{timestamp}.csv"
        json_path = f"output/trending_{GEO}_{timestamp}.json"

        pd.DataFrame(trends).to_csv(
            csv_path,
            index=False,
            encoding="utf-8"
        )

        with open(
            json_path,
            "w",
            encoding="utf-8"
        ) as file:
            payload = {
                "search_parameters": {
                    "geo": GEO,
                    "hours": HOURS,
                    "timestamp": timestamp,
                },
                "trends": trends,
            }
            json.dump(
                payload,
                file,
                indent=2,
                ensure_ascii=False
            )

        print("CSV:", csv_path)
        print("JSON:", json_path)

        browser.close()
We recommend you explicitly use **UTF-8 **for the output files to make sure non-Latin characters found in “Trending Now” results are handled properly. It was an issue for us with the Windows version during testing.
If no output folder exists, then a successful run will create an output folder and save a CSV and JSON file within it. The CSV contains the trend rows extracted, and the JSON also writes the region, timeframe, and timestamp on which the trend was run. Both have fields including:
title
search_volume
started
breakdown 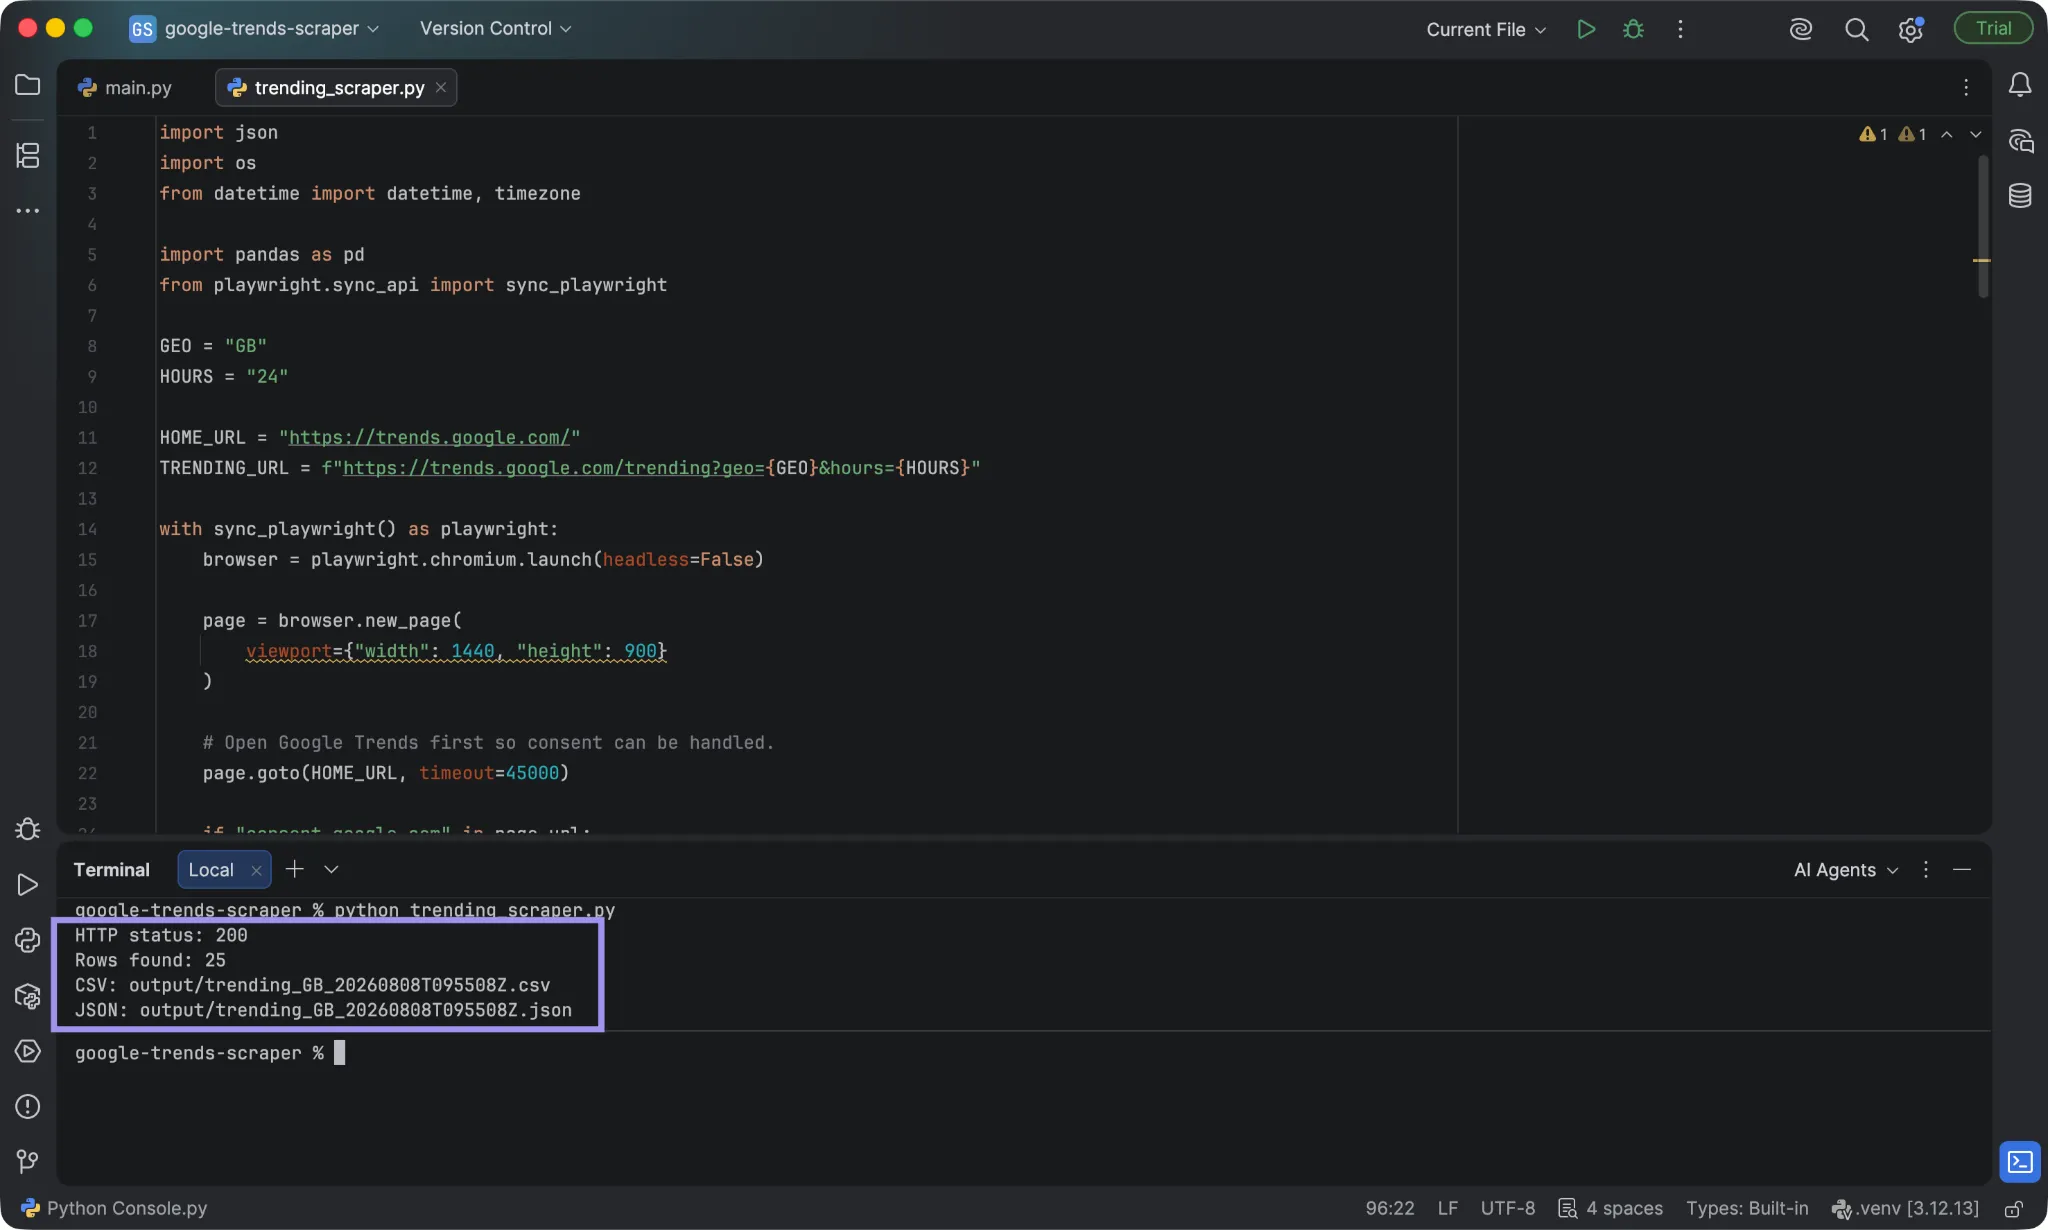
Why Use a Proxy for Repeated Google Trends Scraping?
Repeated scraper runs otherwise go out over your normal internet connection. Routing Playwright through a proxy gives the browser a different exit IP and lets you maintain the same network identity across sequential requests using a sticky session. Adding a proxy at this level doesn't change the extraction logic or require reloading the target page: Playwright still loads and scrapes “Trending Now”.
In our test, the proxied run got the same 25 rows as the direct run, but with a different UK exit IP address. While using a proxy grants control over your exit IP and separates automated traffic from your own connection, it won't necessarily boost the amount of data you can receive from a single run or enable access to data that you can't gain access to directly with your connection.
Generate your proxy credentials
The type of proxy is not a factor in the extraction logic, but it does influence the speed of extraction, pricing, IP characteristics, and the behavior of sessions.
- Residential proxies are passed through real human internet connections through ISPs. So, when you use one, it appears as if you are coming from a regular home or business address instead of a data center. This is helpful for scraping where the site knows where you are, or for tasks where speed is less important. Residential proxies usually cost more than datacenter proxies.
- Static residential proxies are also known as ISP proxies. They combine some advantages of residential with some advantages of datacenter proxies: The addresses are registered to consumer ISPs, but they’re more stable than regular residential ones.
- Datacenter proxies are acquired from the IP addresses of the data center servers. They are inexpensive and quick, but some sites may catch on to you using one and block you or even require a CAPTCHA.
- Mobile proxies are based on mobile data networks. When multiple users access a site via the same IP address, it is difficult for sites to determine whether two requests are from the same user or not. The prices of mobile proxies can vary, though mobile proxies are often among the more expensive types
Session type changes how many IP addresses you’ll use over time. With rotating proxies, the IP changes frequently between requests. Sticky sessions use one address for a while (sometimes called a session).
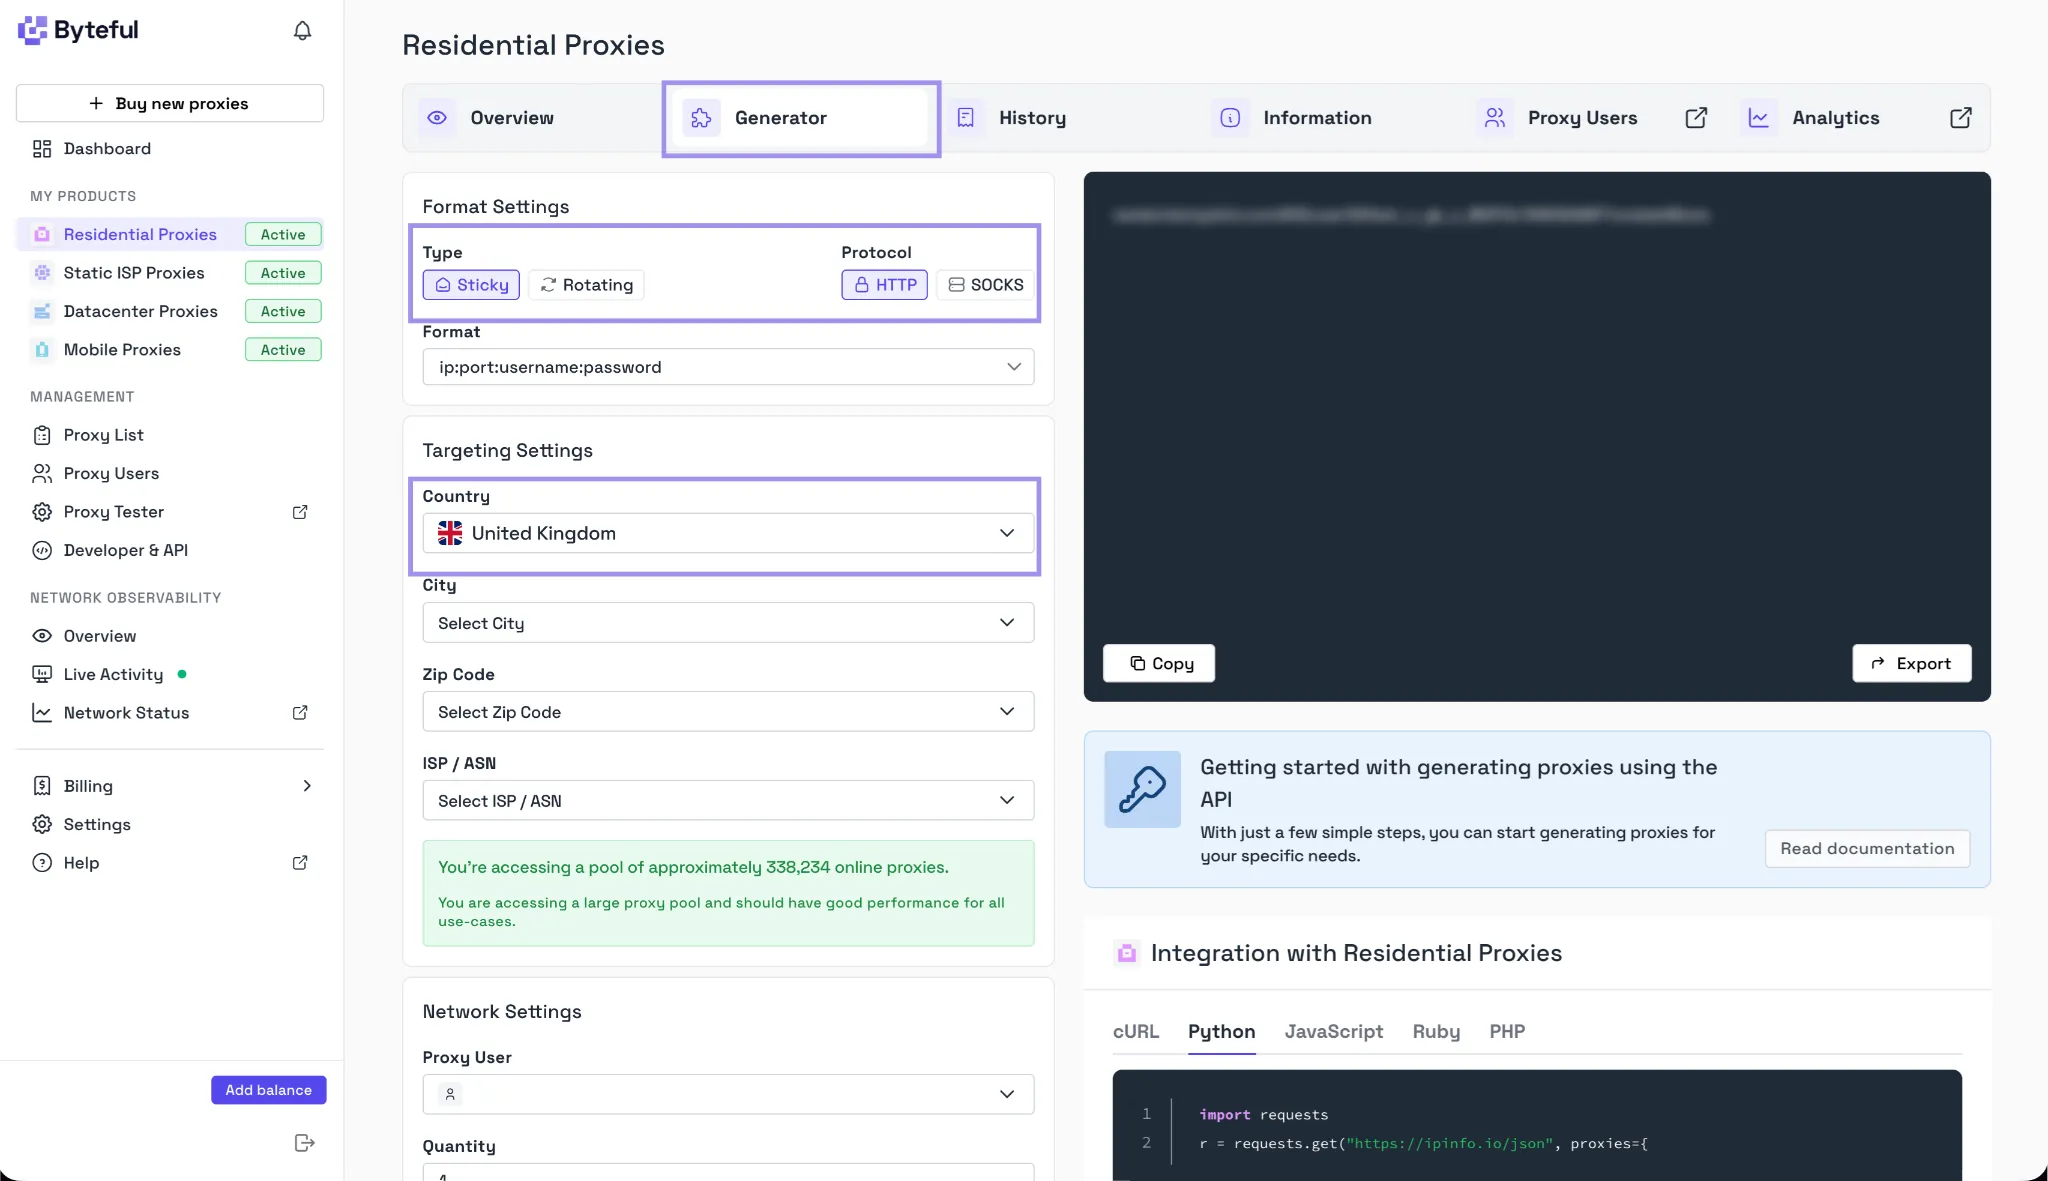
In this tutorial, we’ll use residential sticky sessions because our scraper loads several pages in sequence, and it will be easier for you to interpret if we use one address consistently.
Create the endpoint in the Byteful dashboard and choose the location and session settings you need. New accounts currently include 1 GB of free residential data, which is enough to test a workflow this size. You’ll then receive the proxy host, port, username, and password needed for authentication.
Store the proxy credentials
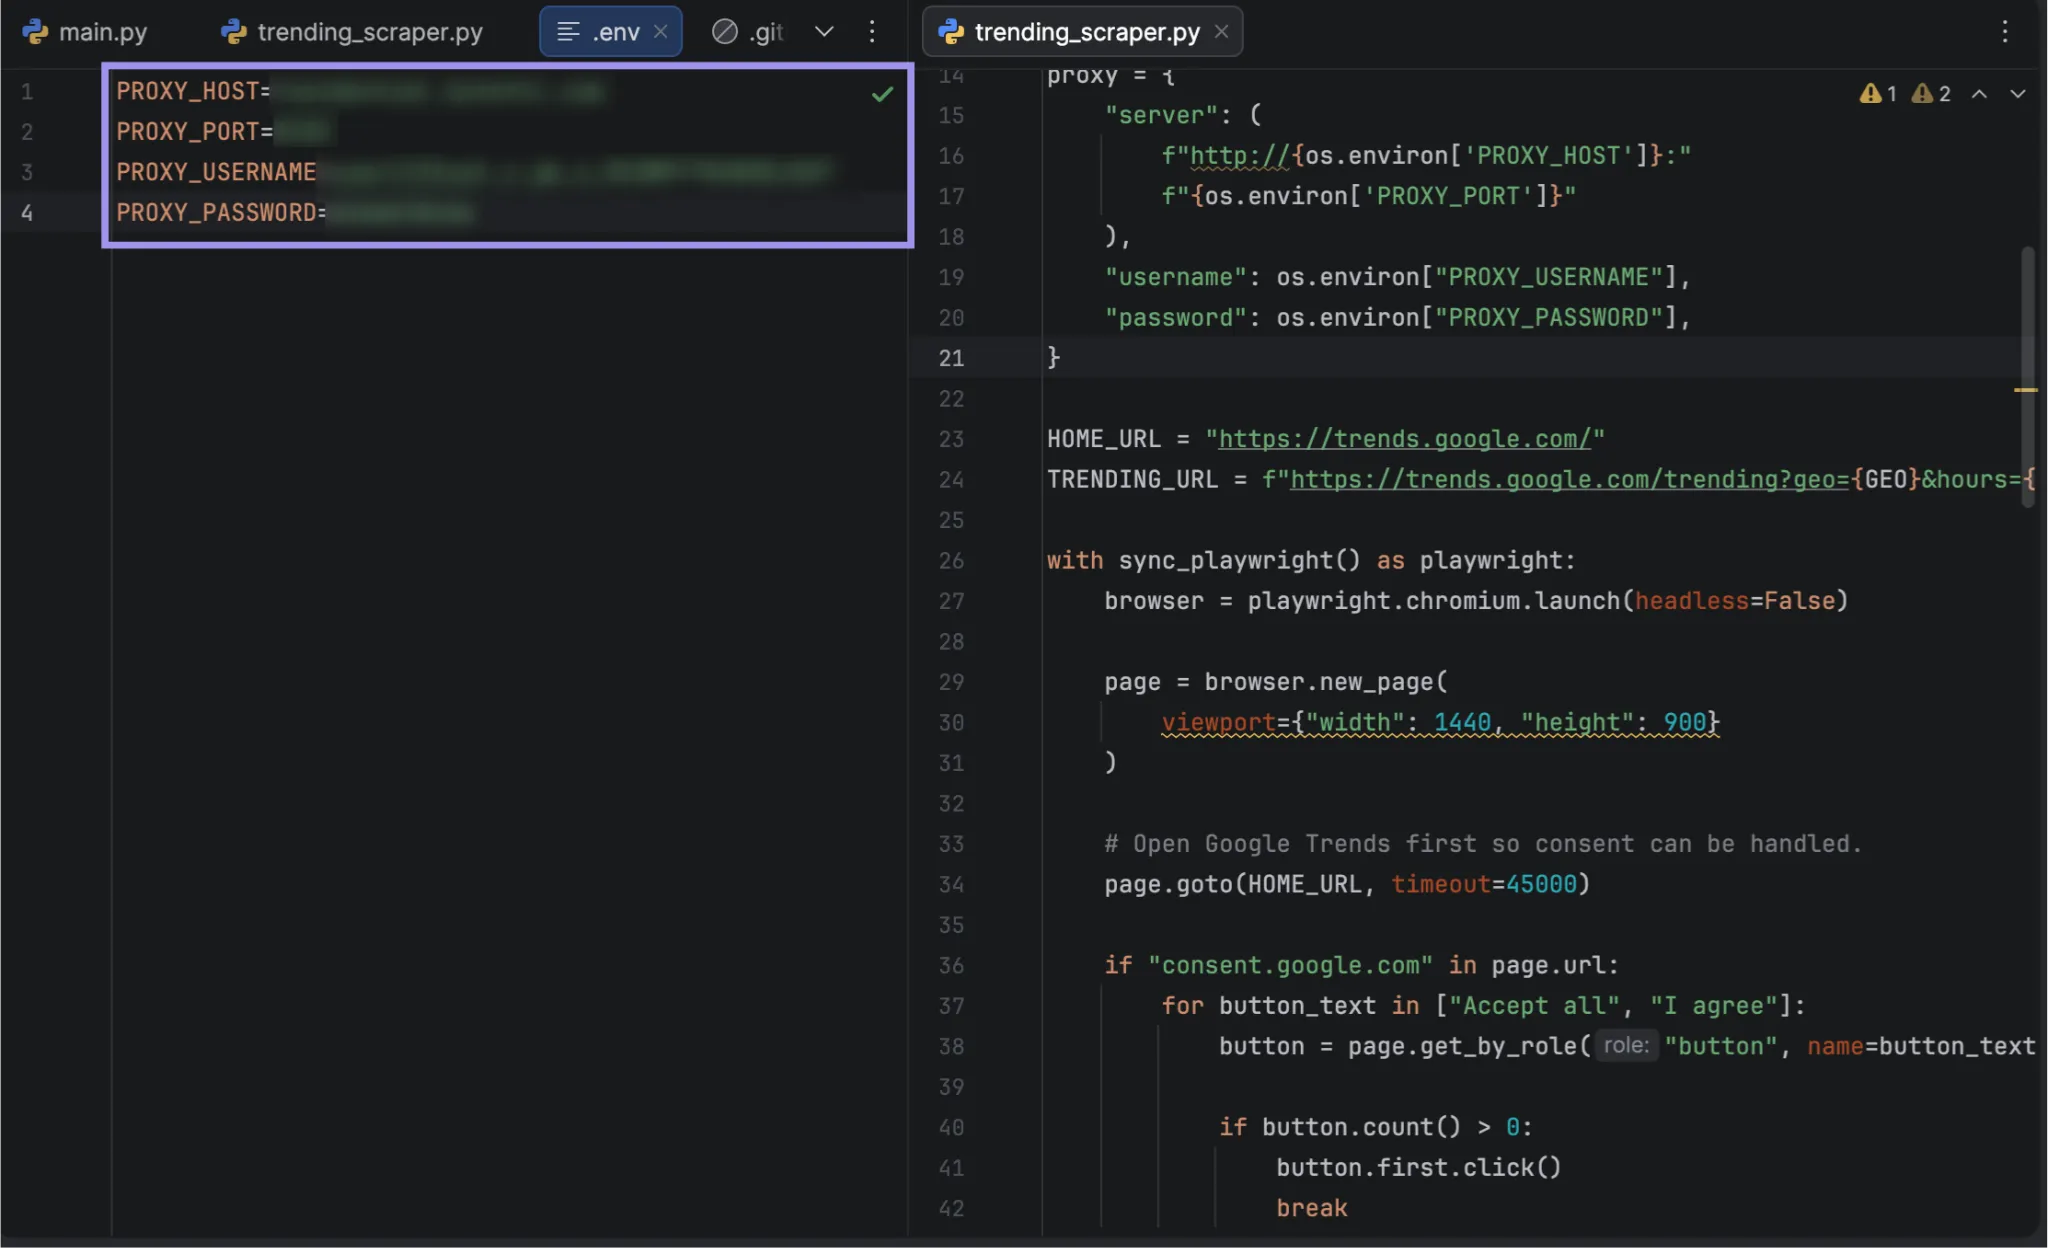
Rather than putting your credentials straight into the Python file, you should store them in a separate .env file located within your project directory.
PROXY_HOST=YOUR_PROXY_HOST
PROXY_PORT=YOUR_PROXY_PORT
PROXY_USERNAME=YOUR_PROXY_USERNAME
PROXY_PASSWORD=YOUR_PROXY_PASSWORD
Keep this file private and exclude it from version control.
python-dotenv loads the values stored in your .env file into the script's environment, letting the scraper access the proxy credentials without hard-coding them into the Python file. Install it with:
pip install python-dotenv Then add the proxy configuration to the script:
from dotenv import load_dotenv
load_dotenv()
proxy = {
        "server": (
            f"http://{os.environ['PROXY_HOST']}:"
            f"{os.environ['PROXY_PORT']}"
        ),
        "username": os.environ["PROXY_USERNAME"],
        "password": os.environ["PROXY_PASSWORD"],
}
Playwright’s proxy configuration uses separate server, username, and password fields, which is why we pass the proxy credentials individually instead of embedding them in the server URL.
Test the proxy endpoint
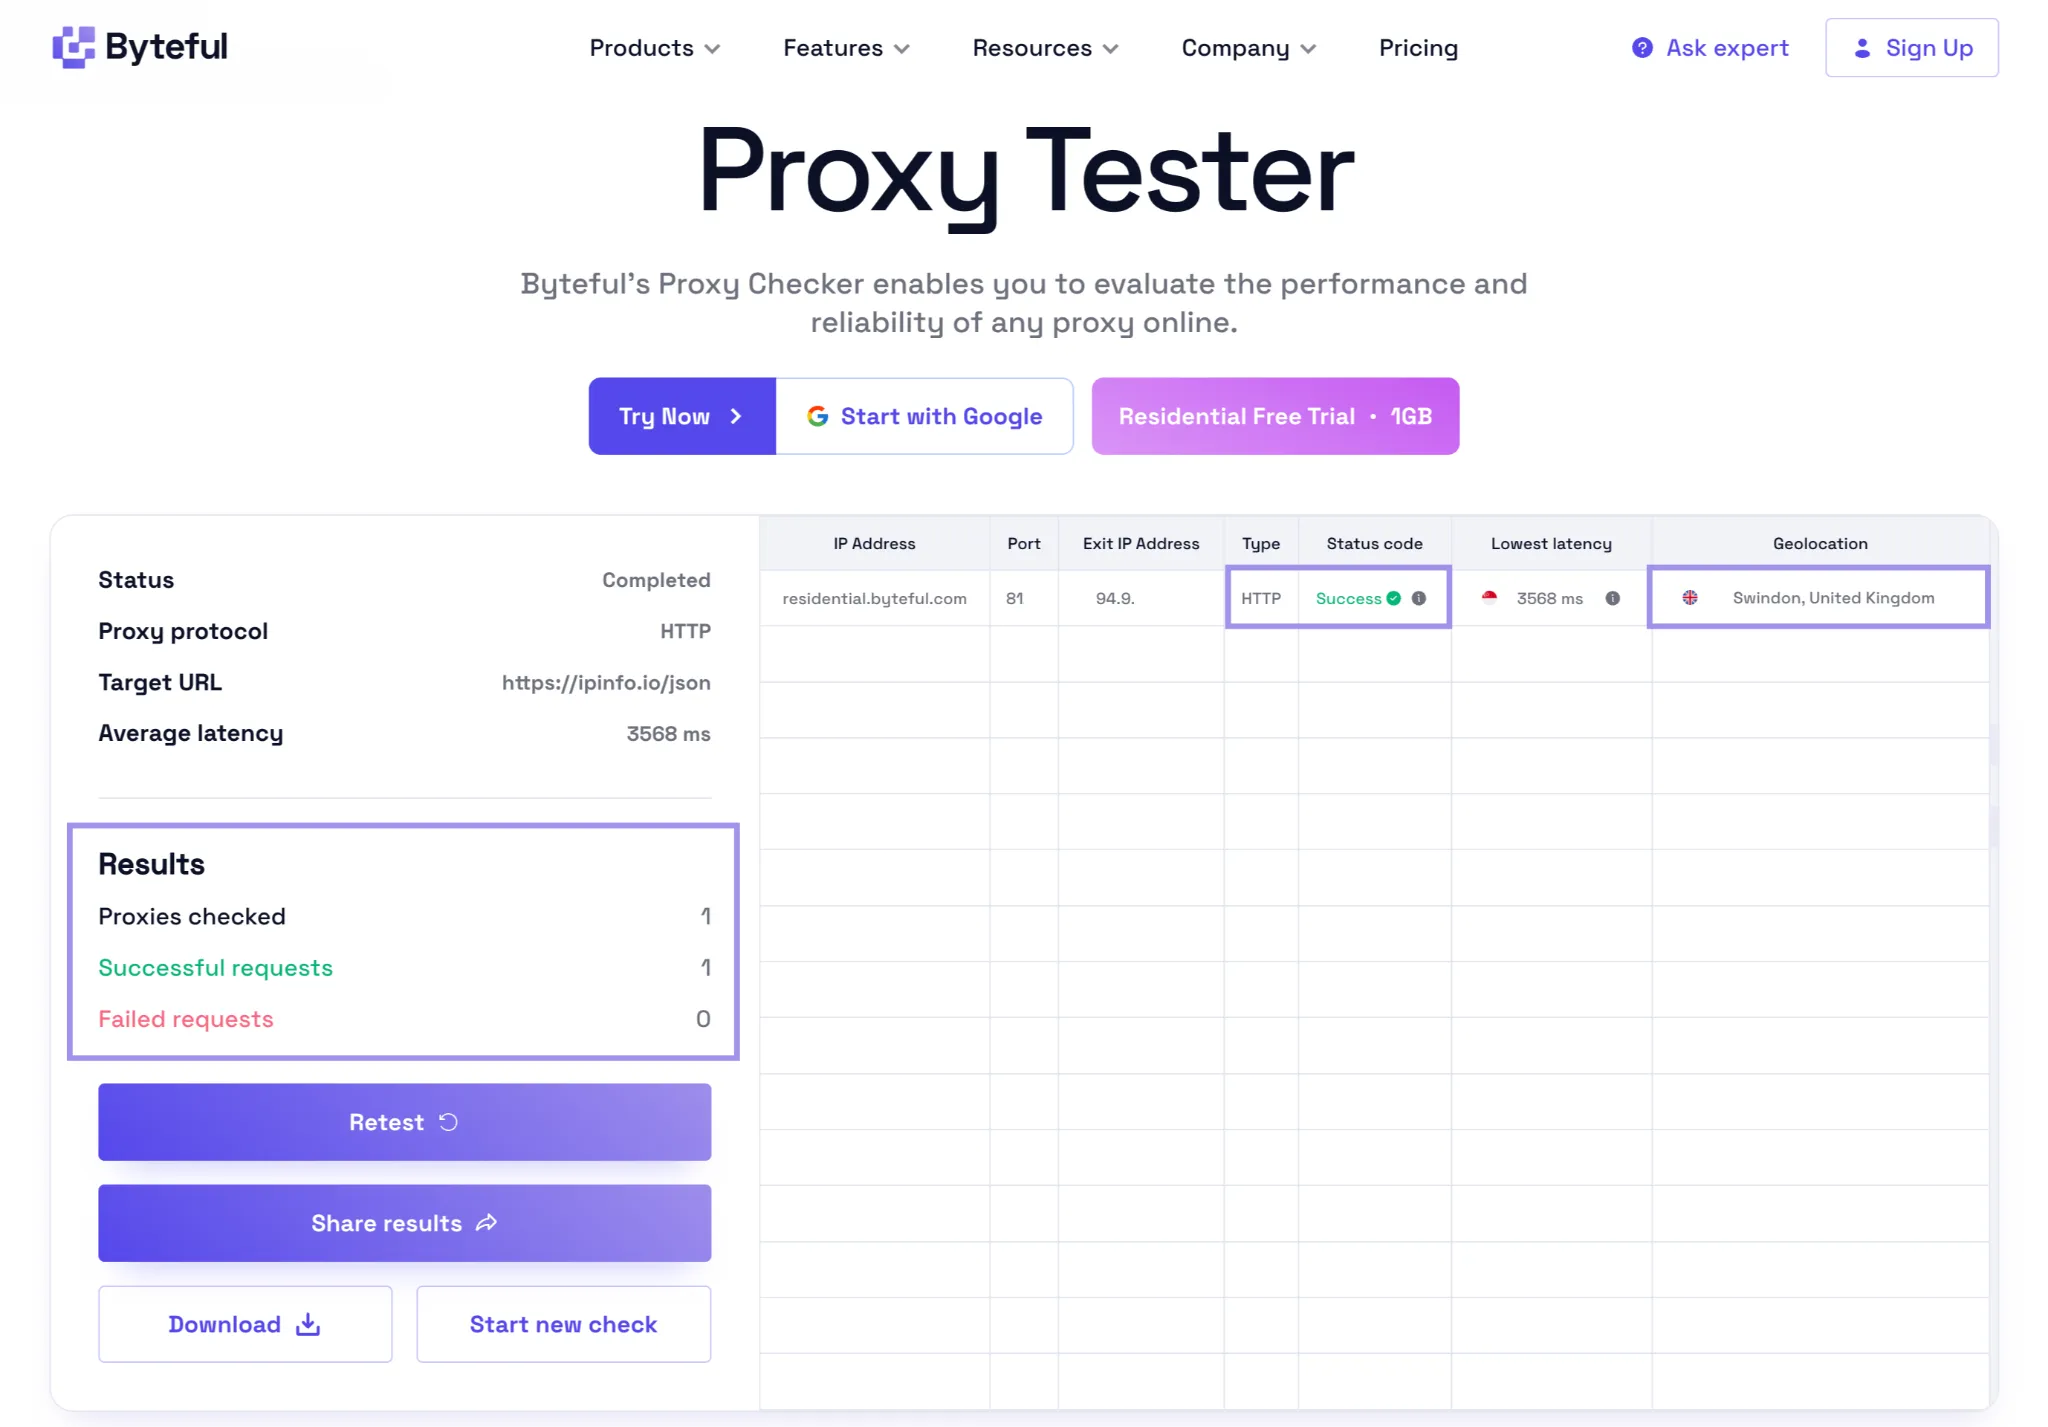
Before adding the endpoint to Playwright, test it with the Byteful Proxy Tester. The tester sends an HTTP request through the proxy and reports whether the connection was successful, the exit IP address, and its geolocation.
This helps identify endpoint or credential issues before moving on to more complex browser configuration problems. Our test endpoint correctly showed a UK IP address.
Route Chromium through the proxy
Replace the browser setup from the previous section with:
browser = playwright.chromium.launch(
        headless=False,
        args=["--disable-http2"]
)
context = browser.new_context(
        proxy=proxy,
        viewport={"width": 1440, "height": 900},
        locale="en-GB",
        timezone_id="Europe/London",
)
page = context.new_page()
The --disable-http2 flag is included because Chromium repeatedly timed out through the specific residential endpoint we tested until HTTP/2 was disabled. This was an endpoint-specific result from our test environment, so it shouldn't be treated as a requirement for every proxy connection.
You don’t need to change any of the loading/extracting/CSV or JSON stuff from the previous section.
Verify Playwright is using the proxy
After setting up the browser context, check that Playwright is routing requests through the endpoint by:
import json
import os

from dotenv import load_dotenv
from playwright.sync_api import sync_playwright

load_dotenv()

proxy = {
    "server": (
        f"http://{os.environ['PROXY_HOST']}:"
        f"{os.environ['PROXY_PORT']}"
    ),
    "username": os.environ["PROXY_USERNAME"],
    "password": os.environ["PROXY_PASSWORD"],
}

with sync_playwright() as playwright:
    browser = playwright.chromium.launch(
        headless=True,
        args=["--disable-http2"]
    )

    context = browser.new_context(proxy=proxy)
    check_page = context.new_page()

    check_page.goto("https://ipinfo.io/json", timeout=30000)
    proxy_info = json.loads(check_page.locator("body").inner_text())

    print("Playwright proxy verification: success")
    print(f"Exit IP: {proxy_info['ip']}")
    print(f"Country: {proxy_info['country']}")

    check_page.close()
    context.close()
    browser.close()
The exit IP should differ from your normal IP address, and the detected country should match the endpoint you chose. This tests the browser context as a whole rather than just the endpoint by itself.
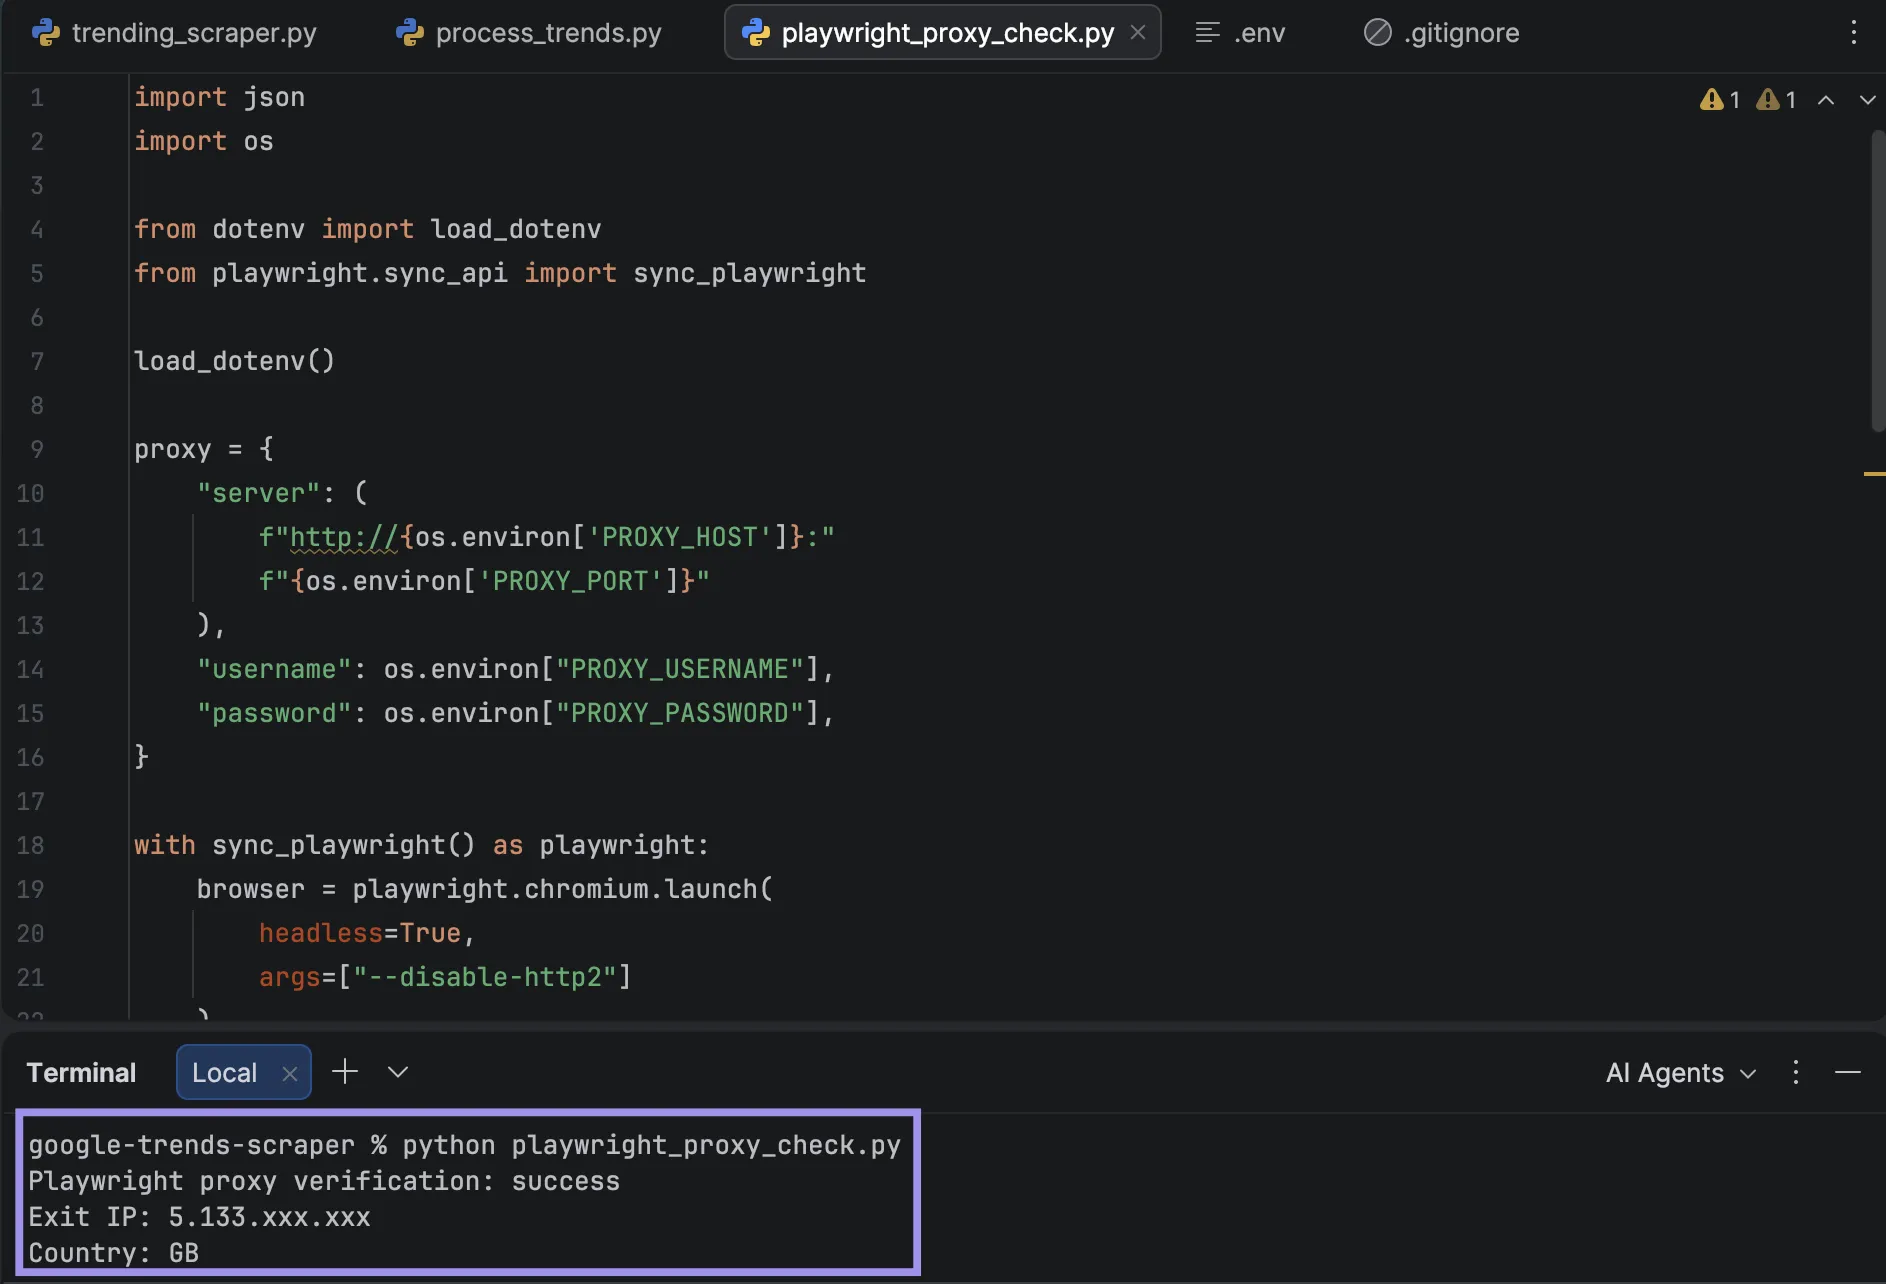
The proxy location setting does not influence the Trends report region setting. For the UK exit IP tests, the same IP was used for the entire duration of the test session since it was “pinned” to that address. The regional differences were not related to the proxy location, but to the Trends geo parameter.
Transient navigation timeouts still occurred after we resolved the HTTP/2 issue, so repeated workflows should include retry handling for failed navigations.
Scraping the Explore Page
If you want to gather more information than the simple trending charts show, look at Explore under Google Trends. You can download CSV files that show “interest over time”, “regional interest”, “related topics,” and “related queries”.
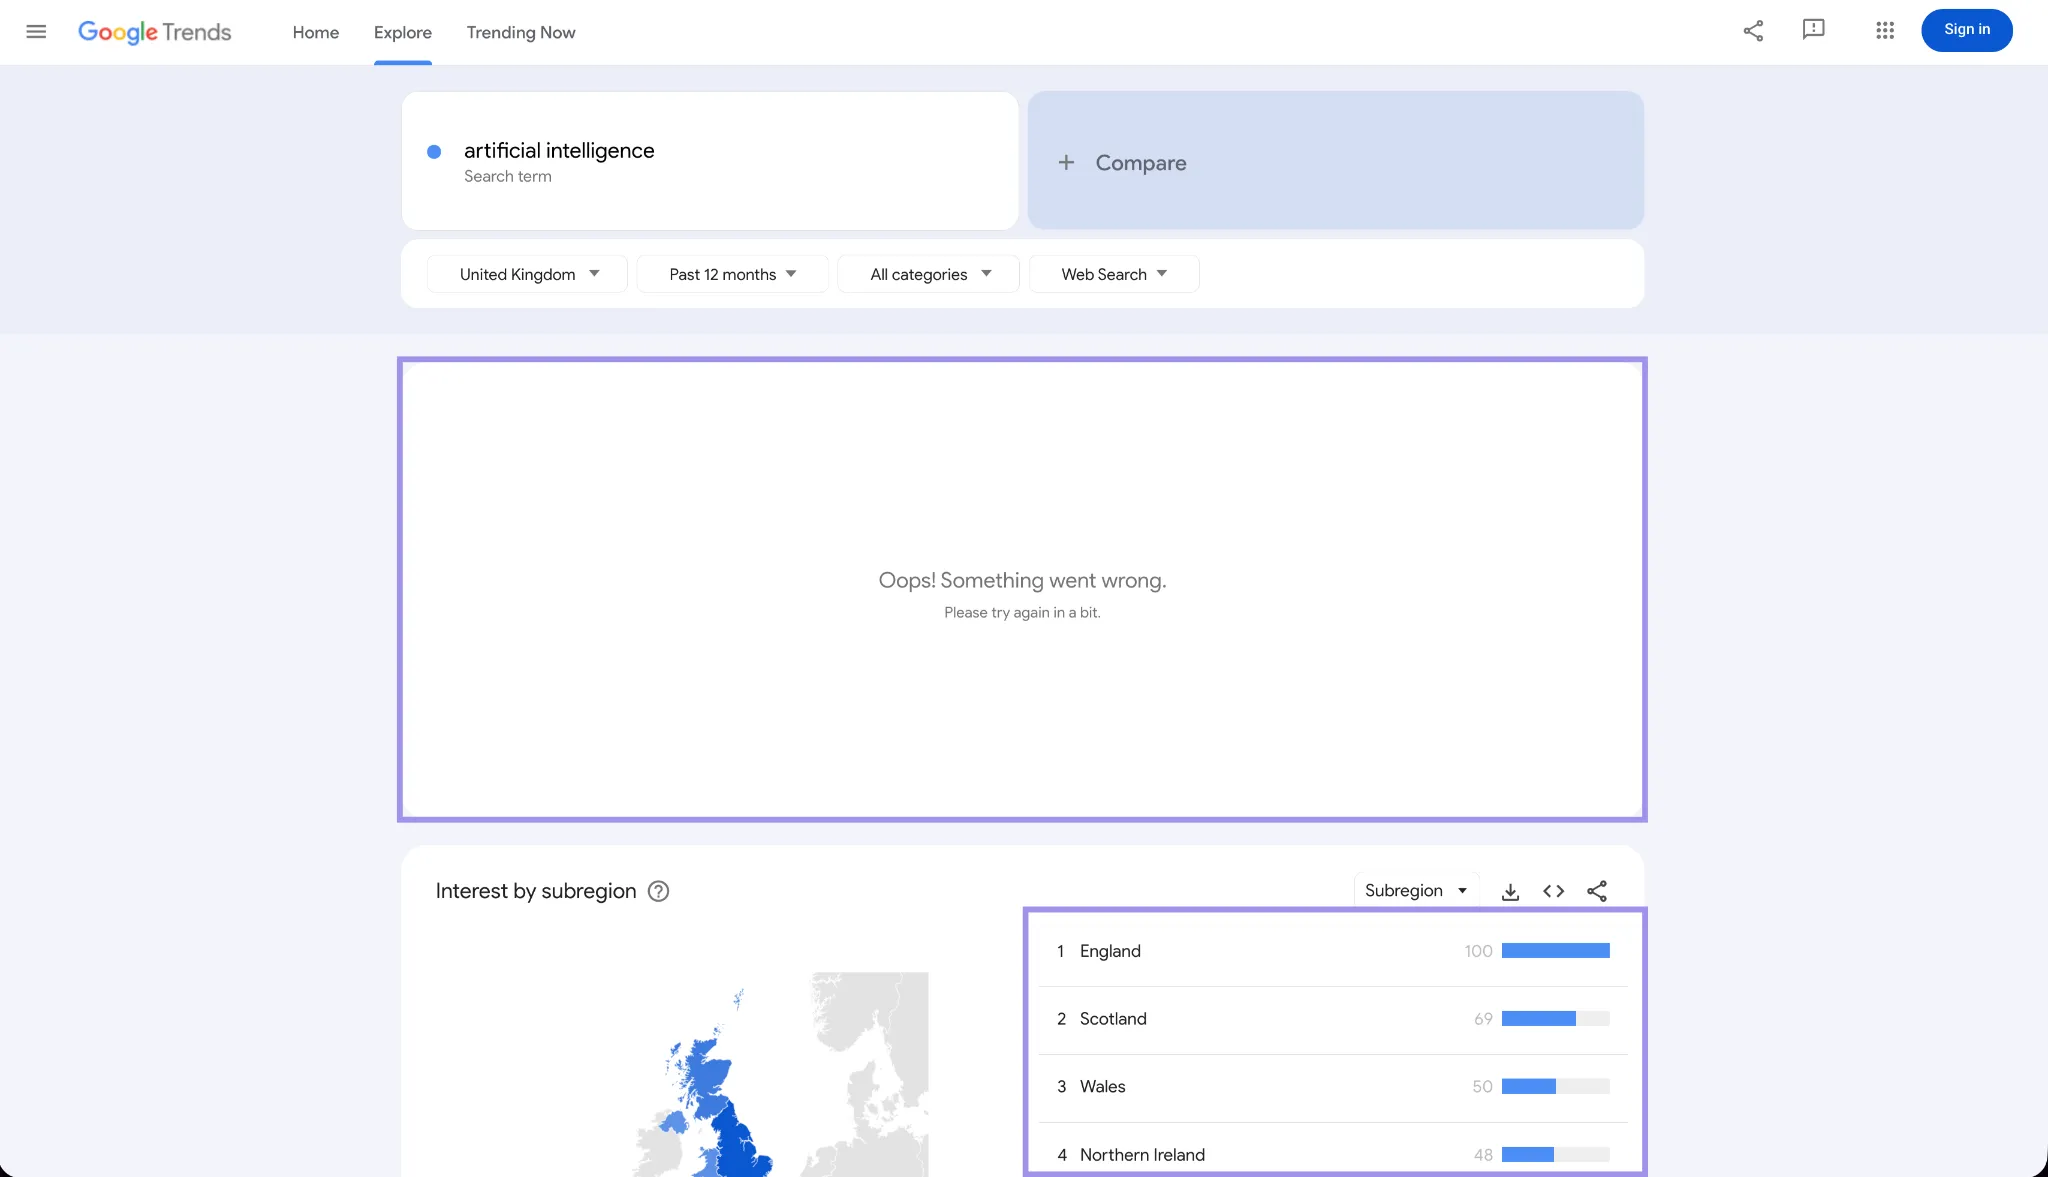
It’s possible to scrape this data for your own use, but be warned: during tests of the same search query a few times in a row, the results were inconsistent. On one attempt, all four widget CSVs downloaded, on another, only three appeared while the fourth widget returned HTTP 429, and on the third try, the widgets never populated at all.
The same proxy configuration will be used as in the last section, with the addition of support for downloading, adding an Explore report URL, scrolling through widgets, and saving to CSV.
No keyword is needed, as Trending Now will give the current trends of the specified region and time frame. Explore works differently. Here we'll use artificial intelligence as the example query, but you can replace the QUERY value below with any term you want to research.
Add the following to the same proxy-enabled script:
from urllib.parse import quote

QUERY = "artificial intelligence"
GEO = "GB"
TIMEFRAME = "today 12-m"

EXPLORE_URL = (
    "https://trends.google.com/trends/explore"
    f"?q={quote(QUERY)}"
    f"&date={quote(TIMEFRAME)}"
    f"&geo={GEO}"
)

os.makedirs("explore_output", exist_ok=True)
def handle_consent(page):
        if "consent.google.com" not in page.url:
            return
        for text in ["Accept all", "I agree"]:
            button = page.get_by_role(
                "button",
                name=text
            )
            if button.count() > 0:
                button.first.click()
                return
with sync_playwright() as playwright:
        browser = playwright.chromium.launch(
            headless=False,
            args=["--disable-http2"],
        )
        context = browser.new_context(
            proxy=proxy,
            accept_downloads=True,
            locale="en-GB",
            timezone_id="Europe/London",
        )
        page = context.new_page()
        page.goto(
            "https://trends.google.com/",
            timeout=45000,
        )
        handle_consent(page)
        page.goto(
            EXPLORE_URL,
            timeout=45000,
        )
        handle_consent(page)
        page.wait_for_timeout(5000)
        # Scroll so the lower widgets can load.
        page.mouse.wheel(0, 3000)
        page.wait_for_timeout(3000)
        export_buttons = page.locator(
            "button.export"
        )
        print(
            "Export buttons found:",
            export_buttons.count(),
        )
        for index in range(
            export_buttons.count()
        ):
            button = export_buttons.nth(index)
            button.scroll_into_view_if_needed()
            try:
                with page.expect_download(
                    timeout=10000
                ) as download_info:
                    button.click()
                download = download_info.value
                download.save_as(
                    os.path.join(
                        "explore_output",
                        download.suggested_filename,
                    )
                )
                print(
                    f"Widget {index + 1}: "
                    f"saved {download.suggested_filename}"
                )
            except Exception:
                print(
                    f"Widget {index + 1}: "
                    "no download received"
                )
        context.close()
        browser.close()
The previous section's proxy variable is carried over here, so you don't need to reload the .env credentials. accept_downloads=True lets Playwright capture Google's CSV files, and expect_download() waits for each export to start.
You must scroll down to see the bottom Explore widgets, as the bottom widgets are only rendered when they are in the viewport.
Not all four exports will be seen each time. Though it can be used for occasional data collection, Explore uses widgets that are unpredictable, so it may disrupt regular scraping jobs.
Processing Trending Now and Explore Data With Python
Once your scraper has produced its files, you can use pandas to transform the raw output into something much simpler to compare. Since Trending Now and Explore produce somewhat different datasets, they require slightly different processing methods.
Process the Trending Now output
Start with the CSV created by the Trending Now scraper above. It contains fields such as title, search_volume, started, and breakdown.
import pandas as pd

data = pd.read_csv(
    "output/trending_GB_YOUR_TIMESTAMP.csv"
)

def clean_volume(value):
    value = str(value).replace("\\n", "\n")
    return value.splitlines()[0].strip()

def parse_volume(value):
    value = clean_volume(value)

    value = (
        value
        .replace("+", "")
        .replace(",", "")
        .strip()
        .upper()
    )

    if value.endswith("K"):
        return float(value[:-1]) * 1_000

    if value.endswith("M"):
        return float(value[:-1]) * 1_000_000

    return pd.to_numeric(
        value,
        errors="coerce"
    )

data["volume_numeric"] = (
    data["search_volume"]
    .apply(parse_volume)
)

data["display_search_volume"] = (
    data["search_volume"]
    .apply(clean_volume)
)

top_trends = (
    data.sort_values(
        "volume_numeric",
        ascending=False
    )
    [["title", "display_search_volume"]]
    .head(10)
    .rename(
        columns={
            "display_search_volume": "search_volume"
        }
    )
)

print(
    top_trends.to_string(
        index=False
    )
)
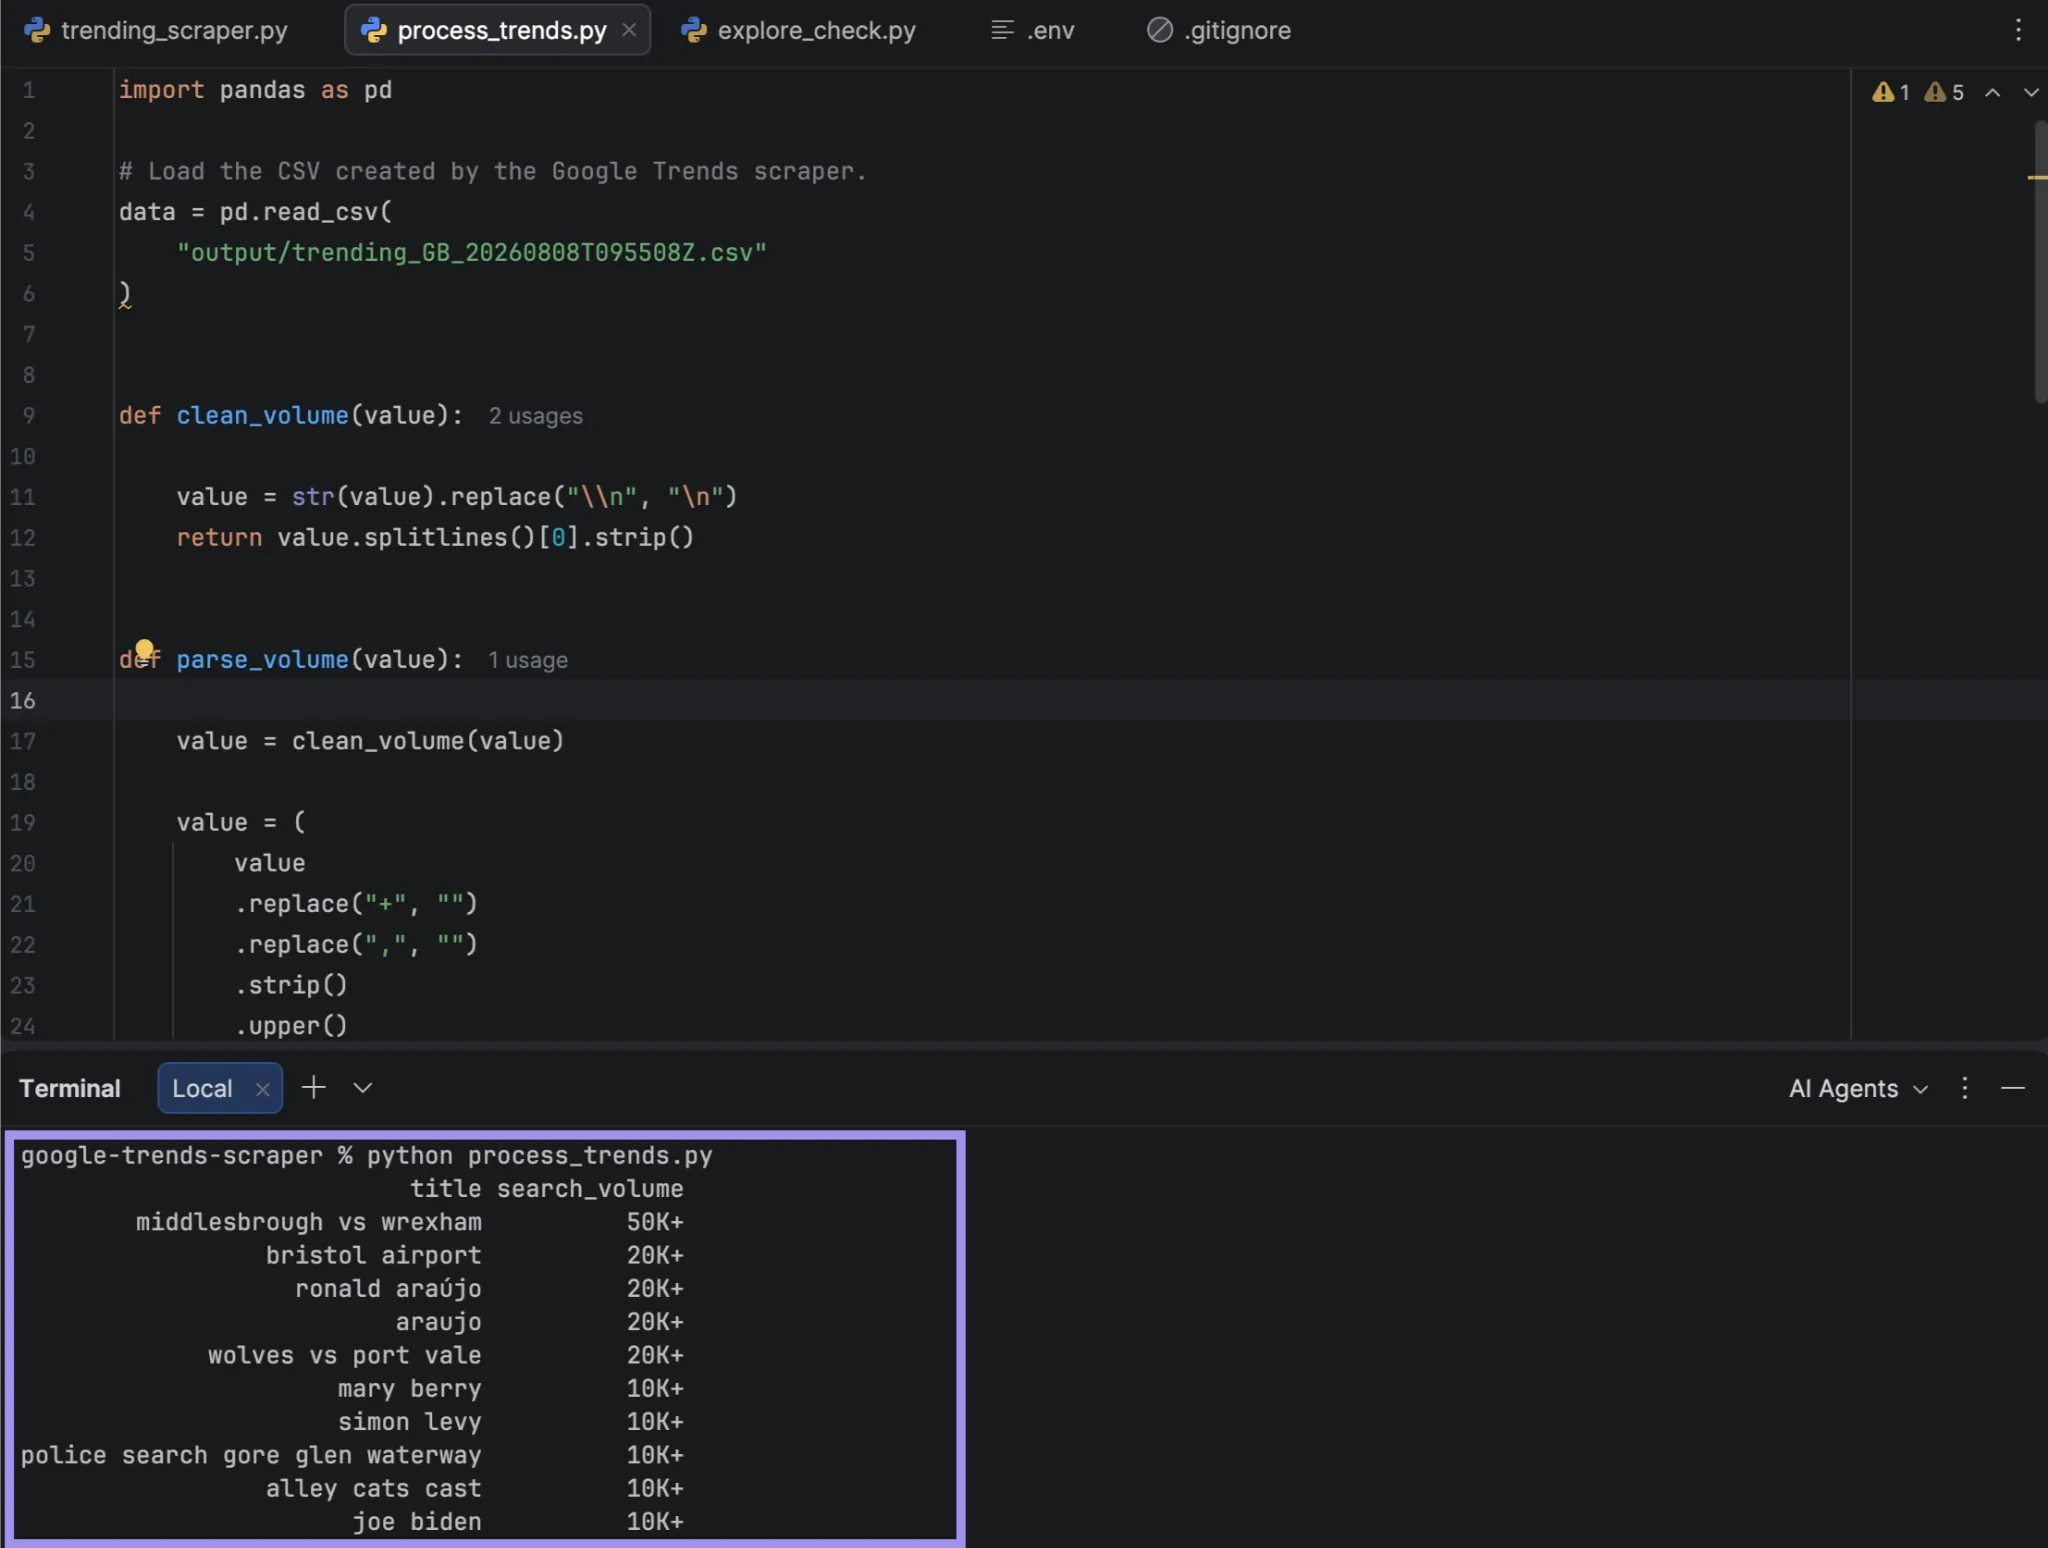
The helper converts values such as 100K+ into numbers for sorting; an additional display column strips the extra percentage-change text from the terminal output. The original search_volume column stays unchanged in the dataset.
Analyze the Explore output
To view interest trends over time, download the CSV from the very first Explore widget from earlier in this section. Google Trends appends two metadata rows at the beginning of the CSV file. After these, our UK export has Week and Artificial Intelligence: (United Kingdom) as its columns.
matplotlib is a Python plotting library that we'll use to turn the Explore interest-over-time data into a line chart. Install it if you don't already have it:
pip install matplotlib Then load and analyze the file:
import pandas as pd
import matplotlib.pyplot as plt

file_name = (
    "explore_output/"
    "YOUR_INTEREST_OVER_TIME_FILE.csv"
)
Replace **YOUR_INTEREST_OVER_TIME_FILE.csv **with the filename downloaded from the first Explore widget.
data = pd.read_csv(
    file_name,
    skiprows=2
)
time_column = data.columns[0]
keyword_column = data.columns[1]

data[time_column] = pd.to_datetime(
    data[time_column]
)

data[keyword_column] = pd.to_numeric(
    data[keyword_column],
    errors="coerce"
)

peak = data.loc[
    data[keyword_column].idxmax()
]

average = data[keyword_column].mean()

print("Peak interest:")
print(
    peak[
        [time_column, keyword_column]
    ]
)

print(
    "Average interest:",
    round(average, 2)
)

plt.figure(
    figsize=(10, 5)
)

plt.plot(
    data[time_column],
    data[keyword_column]
)

plt.title(
    "Google Trends Interest Over Time"
)

plt.xlabel("Week")
plt.ylabel("Relative interest")
plt.ylim(0, 100)

plt.tight_layout()
plt.show()
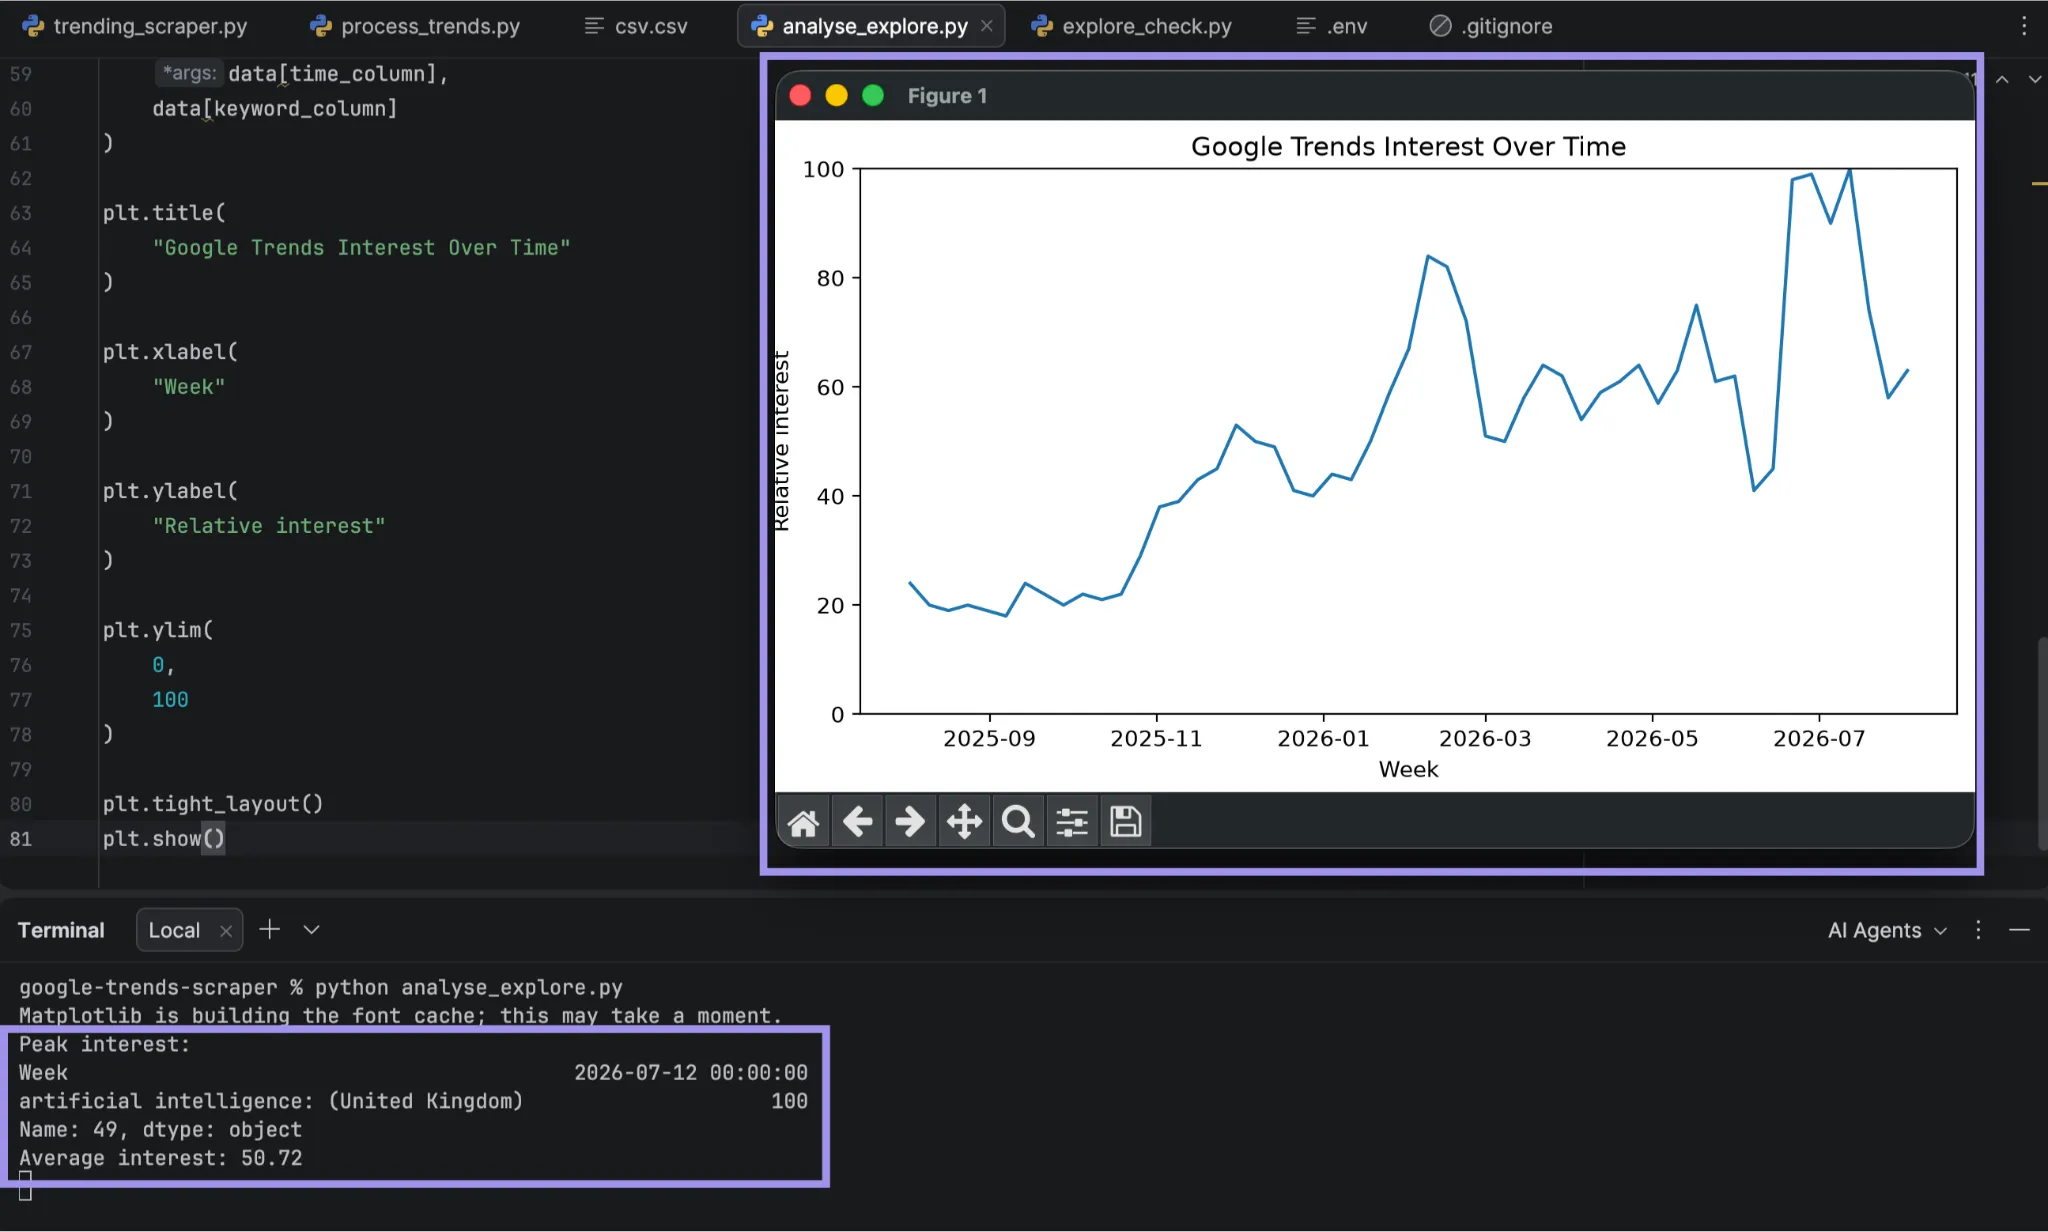
Google Trends again adds those initial metadata rows, so your script needs to skip past them before extracting the weekly dates and relative-interest values. Then it calculates both the maximum and average value before finally plotting your UK dataset.
Google Trends Scraping Alternatives
Creating your very own scraper will give you complete control over the workflow, yet it also entails keeping up-to-date with browser automation whenever Google alters the webpage.
If you'd rather not maintain browser automation yourself, there are three routes to consider: an API for programmatic requests, a no-code scraper for configured runs, or a pre-built dataset when published trend data is enough.
Whichever route you choose, validate a few sample outputs against the browser view. We saw Explore results vary across identical runs, so the returned data should be checked before you rely on it.
| Approach | Option | Best for | Starting price |
|---|---|---|---|
| API | Decodo | Programmatic Google Trends collection | Free plan; paid plans from $19/month |
| No-code scraper | Apify Google Trends Scraper | Configured runs without building the scraper yourself | From $3 per 1,000 results at the time of testing |
| Pre-built dataset | Google Trends dataset in BigQuery | Published top and rising searches without scraping | Free tier available |
Decodo
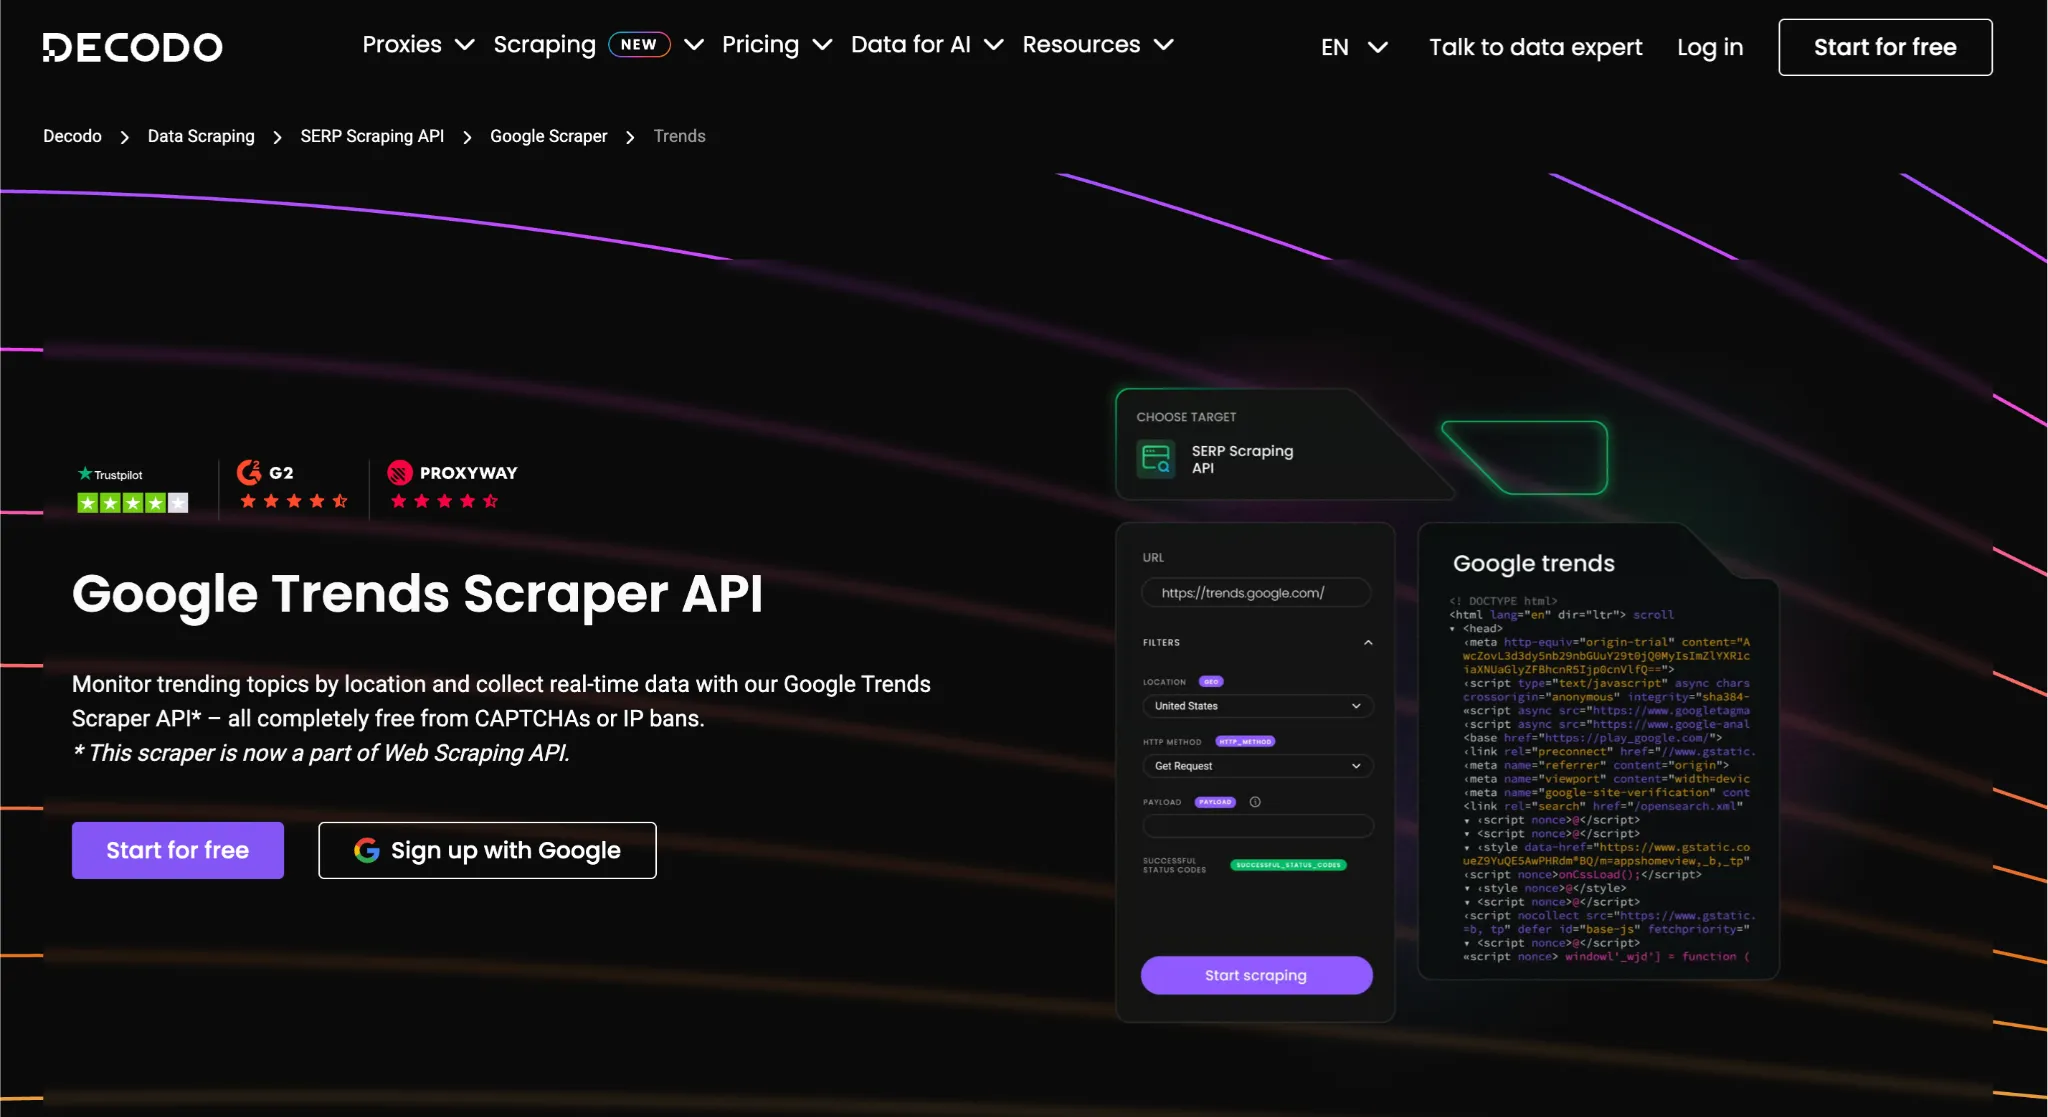
Decodo, formerly known as Smartproxy after its rebranding in April 2025, lists Google Trends as a special target within its Web Scraping API. You simply send a request defining the keyword, date range, and location, rather than driving a browser yourself.
Features
- Dedicated Google Trends Explore target within the Web Scraping API
- API Playground for testing a request and seeing the JSON response before writing code
- The results are provided in the dashboard and come in a variety of export formats.
- 24/7 live chat support
Cons
- The price depends on the proxy pool and the use of JavaScript rendering.
- The cost varies with the number of requests that are submitted.
Apify
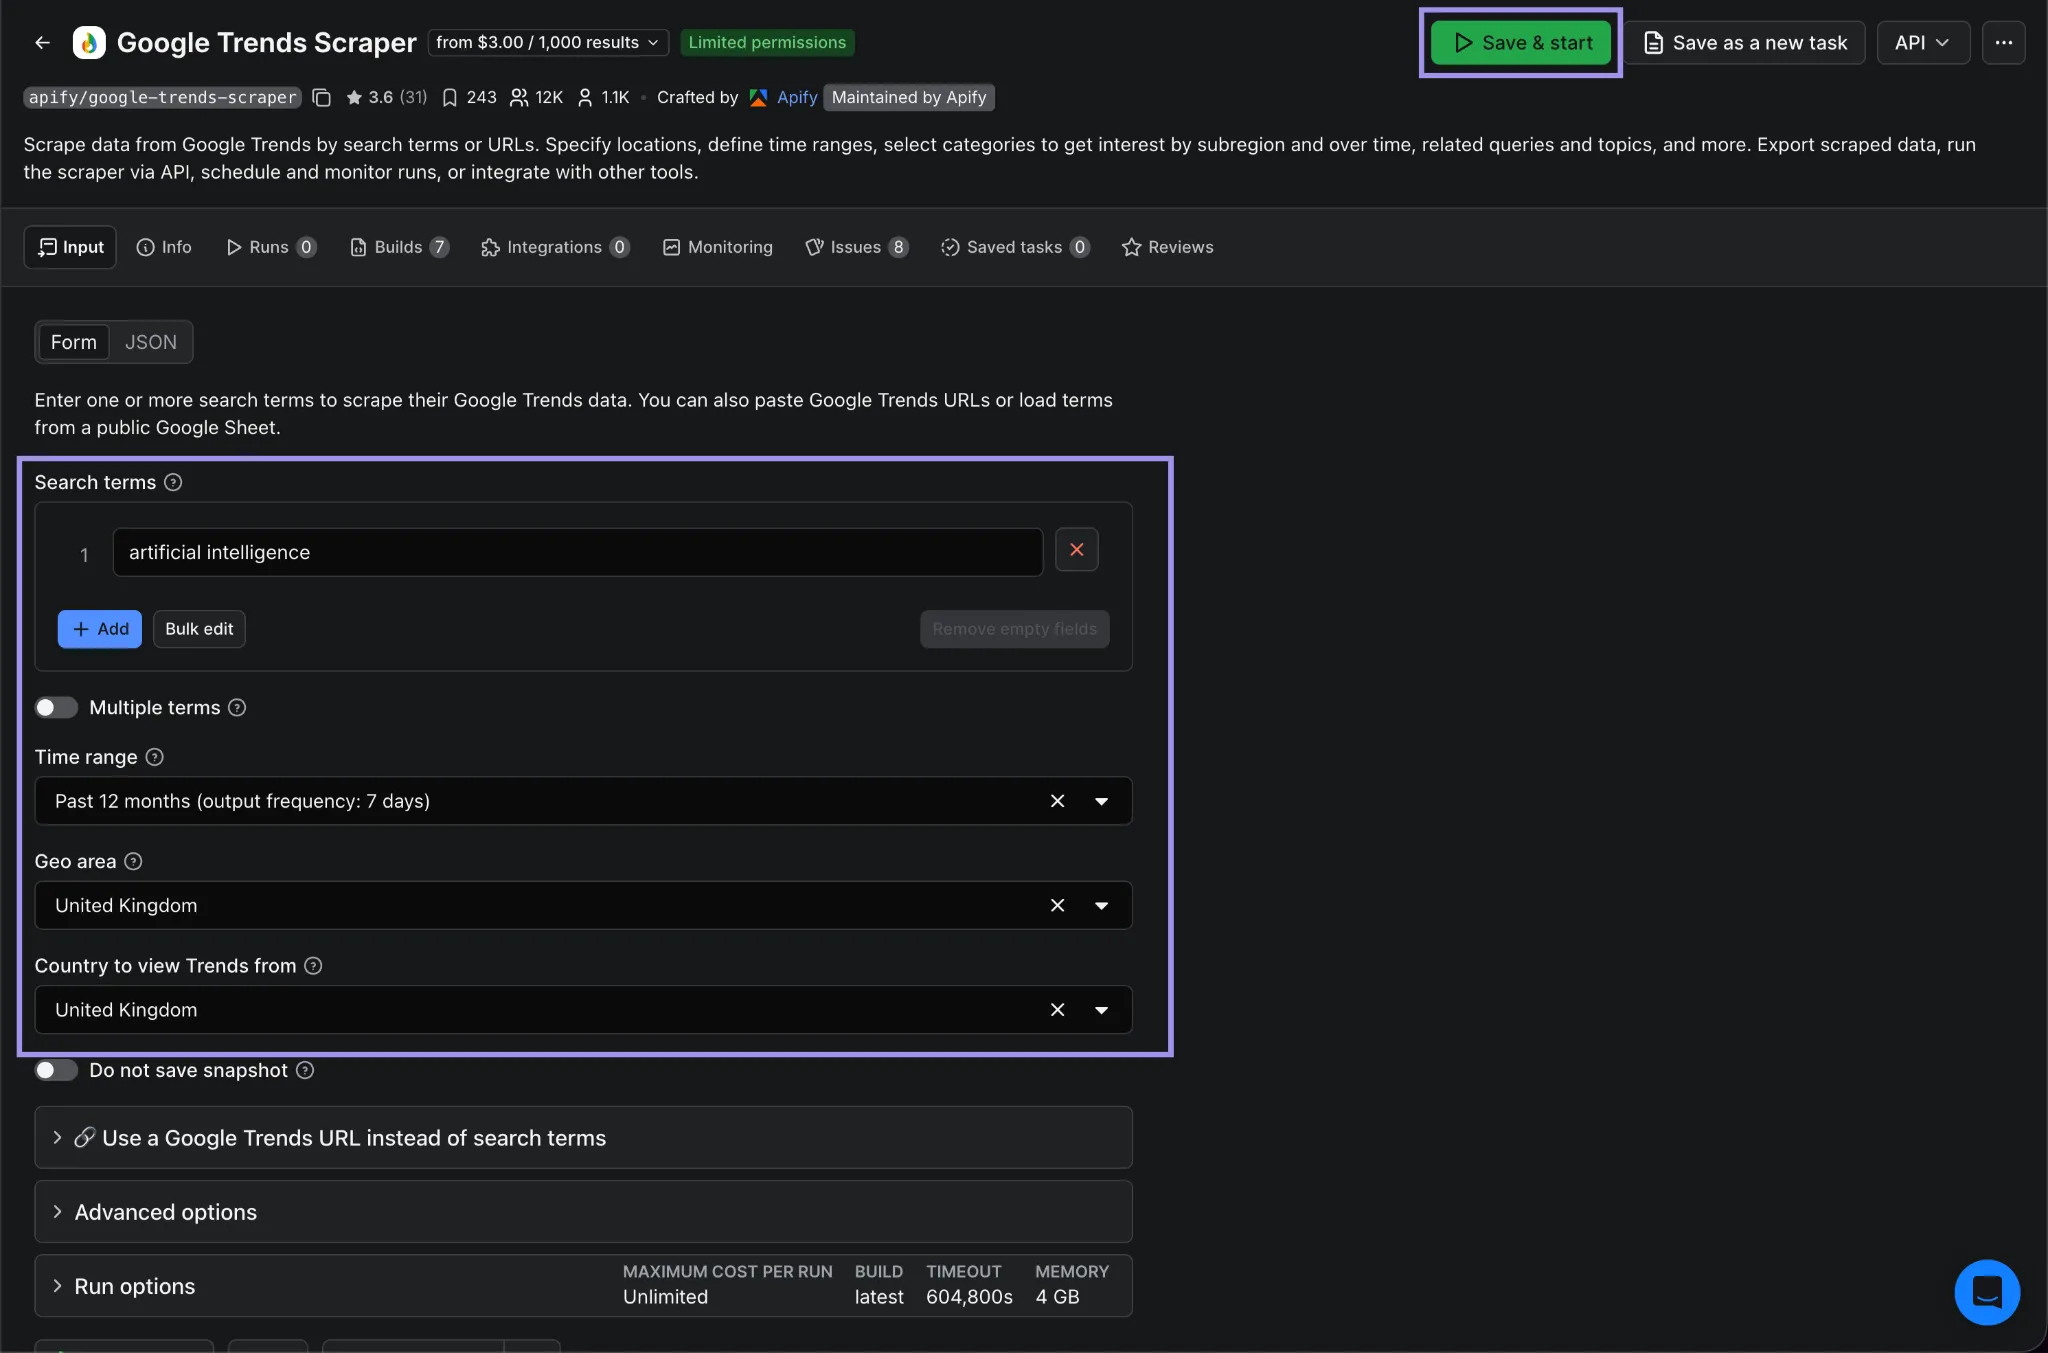
Apify's Google Trends Scraper can be run directly from its web interface, so you don't need to build the browser automation yourself. Enter a search term or Google Trends URL, choose the location and time range, start the run, then download the resulting dataset.
Features
- No-code input form for search terms, locations, and time ranges
- Interest over time, regional interest, related queries, and related topics
- Results available as JSON, CSV, Excel, XML, or HTML
- Runs can also be scheduled or accessed through the Apify API
Cons
- Pricing scales with the number of results
- You have less control over the extraction logic than with your own scraper
Google Trends Dataset in BigQuery
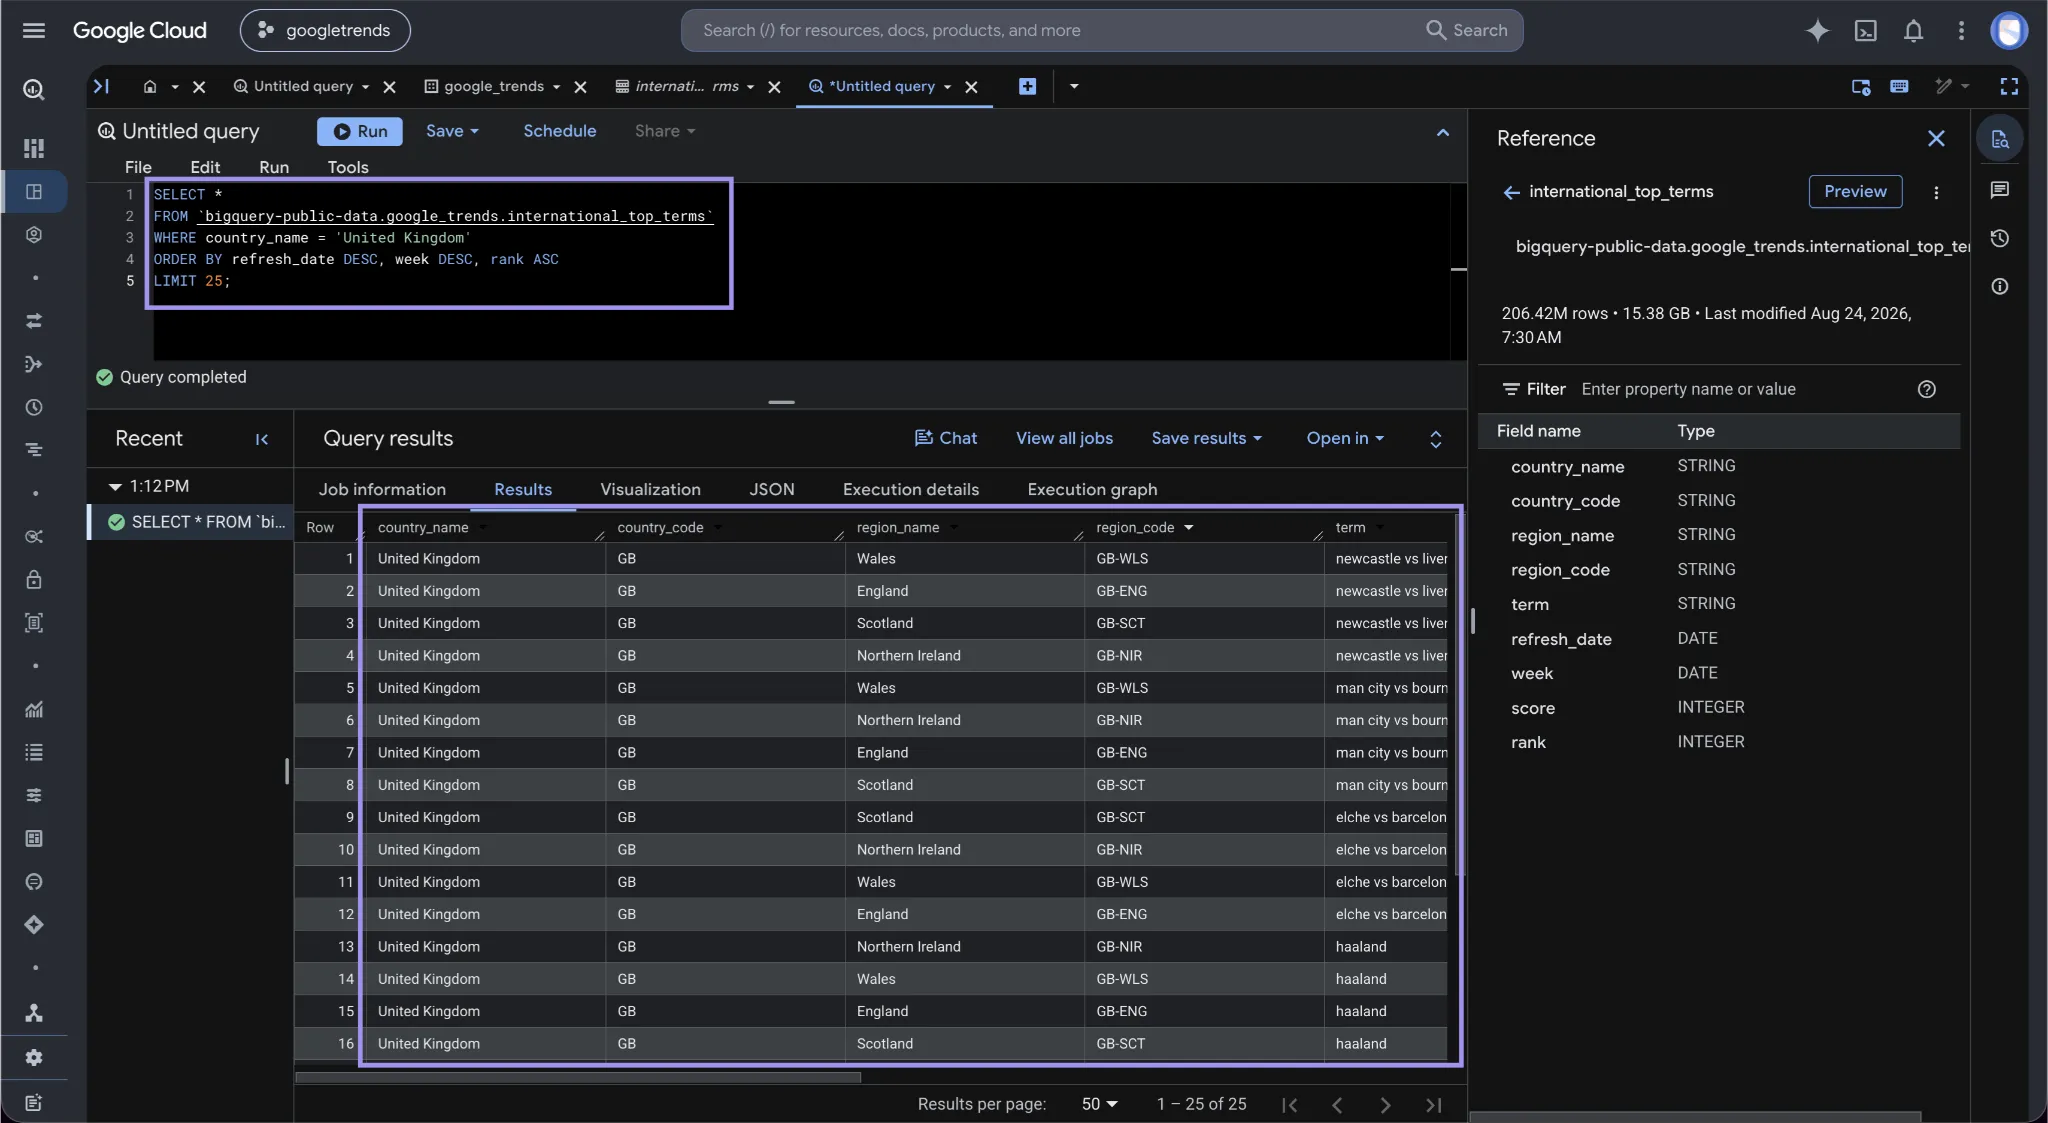
Google publishes pre-built Trends datasets through BigQuery. Instead of scraping a page or sending requests to a scraper API, you query Google's aggregated dataset directly, making it useful when the published top and rising searches already cover what you need.
Features
- Top 25 overall and Top 25 Rising queries
- US data across 210 Designated Market Areas
- International data covering approximately 50 additional countries
- Daily US and international data with a rolling five-year history
- US hourly data with a rolling one-year history
Cons
- Limited to the top and rising queries included in Google's published datasets
- It doesn't replace Explore when you need arbitrary keyword comparisons
These options reduce the browser automation you need to maintain, but the trade-offs differ. Managed tools add usage costs and give you less control over extraction, while BigQuery is limited to the datasets Google publishes.
What Can Go Wrong When Scraping Google Trends?
If a Google Trends scraper fails, don't change the entire setup, but start by focusing on the symptom. The following table outlines the problems we had with our testing and possible causes and solutions.
| Problem | Likely cause | Fix |
|---|---|---|
| HTTP 429 response | Request rate is too high | Reduce request frequency and retry with backoff |
Playwright times out while requests works | Chromium negotiating HTTP/2 through the tested proxy tunnel | Disable HTTP/2 when launching Chromium |
| Proxy authentication fails | Credentials are passed incorrectly | Use Playwright's separate server, username, and password fields |
UnicodeEncodeError on Windows | System-default file encoding isn't UTF-8 | Set encoding="utf-8" when writing files |
| Characters look garbled in PowerShell | Console code page | Run chcp 65001 before the scraper |
| Explore loads but widgets stay empty | Explore data loading is inconsistent | Retry the run rather than relying on unattended scheduling |
| Results show the wrong region | Trends report region is misconfigured | Check the geo parameter separately from the proxy location |
Every problem above came up during our own testing rather than being a hypothetical troubleshooting case. We should point out the encoding failure, as Python's default file encoding is still platform-dependent: A script that prints Hindi or Arabic trend titles correctly on macOS can fail with an encoding error on Windows, if the trend titles are in those languages.
Two findings ruled out a couple of likely causes. Headless mode wasn't the problem: both headed and headless tests returned an HTTP 200 status code and 25 rows. Google's reCAPTCHA elements loaded without a challenge in our tests, so just their presence doesn't necessarily mean a blockage.
To get more reliable data, be sure to be consistent in the way you collect data as well:
- Save the query settings with each output: Remember the keyword, time frame, and region in the CSV or JSON to be able to recreate a report, or to explain the differences between two sets of data.
- Keep the raw files: Save the original exports before cleaning or calculating anything, so you will always have the original data to go back to.
- Validate before analyzing: Check the counts of rows and columns, and check some sample data. Search interest is an indicator, not a direct measure, of behavior, so use other measures of behavior to compare before interpreting.
- Keep comparisons consistent: Ensure that all of the runs are conducted in the same time frame, geo value, query, and report type. Numbers are relative, so the changes made, even slight ones, will make the two sets of numbers look very different, even if the amount of interest has not actually changed.
- Control automation frequency: space out repeated requests and avoid collecting the same report too often, so it's a lot easier to spot rate limit problems.
