


The big issue is that most proxy comparisons break the moment you have to take action based on them. You see a provider reaches "99.9% uptime," you invest, and your scraper still slows to a crawl or is denied access on the targets that matter to you. The issue is rarely with the headline number. The caveat, though, is that the number was collected in conditions completely unrelated to your job, and so it will not survive first contact with production.
The fix is to control your variables, test against the targets you actually use, and report the spread instead of a single average. In this guide, we show you how to do exactly that across residential, ISP, and datacenter proxies.
What are proxy performance benchmarks?
A proxy performance benchmark is a method of testing in an environment with parameters you define to compare one provider or type of proxy against another on the same playing field. That is not one impressive statistic; that is testing the proxy on how your actual work performs and repeating that same test in exactly the same way each time.
Independent media outlets run large-scale versions of this too. The annual Proxyway proxy market research, for example, benchmarks more than a dozen major providers on success rate, response time, and pool size under a shared methodology. Reports like these are a useful starting reference, but the point of this guide is that you can build your own benchmark tuned to your exact use case, which will always tell you more about how a proxy will behave for your workload than any general-purpose leaderboard.
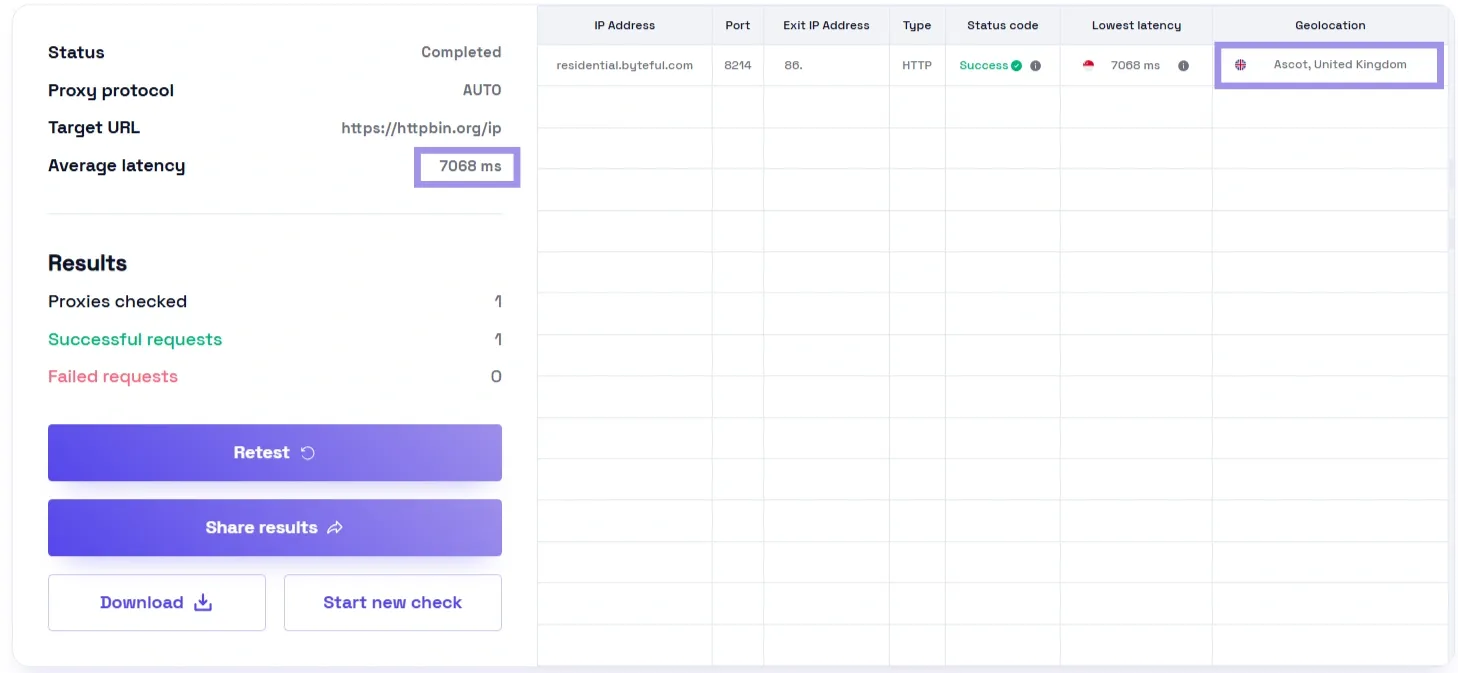
Speed and reliability are covered by most benchmarks. Two more are important for proxy pools. Targeting accuracy is the frequency with which you are in the country or city you requested; quantify it by requesting a well-known region and verifying the exit IP across two or three IP databases, since these disagree more than expected.
Node count indicates the unique IPs that the pool actually draws from. Count it as a unique-IP rate over a few hundred calls, not the one you see on the pricing page. A pool can advertise millions of IPs, but if your traffic keeps hitting the same oversubscribed subset, your real benchmark will tell a different story.
Speed and stability: latency, throughput, and session durability
Latency is the wait before data arrives. Track time to first byte (TTFB), which is the difference between when a request is sent and when the first byte of the response arrives, since it decouples the round trip from payload size.
Because a proxy adds another network hop, its TTFB is usually higher than a direct connection. The useful number is the difference between the direct baseline and the proxied request.
Throughput is the amount of data passing through once the response starts, in requests per second or megabits per second (Mbps), and with no dependence on latency. A residential node can have fast response but slow bandwidth, and you need both: small-page workloads are latency-sensitive, large-file ones are bandwidth-sensitive.
Session durability is how long the session can last until it expires (or rotates). Sure, you get great TTFB from a proxy, but a session that dies halfway through a complex multi-step login flow is useless, so durability should be part of the benchmark.
Reliability: success rates, error rates, and uptime
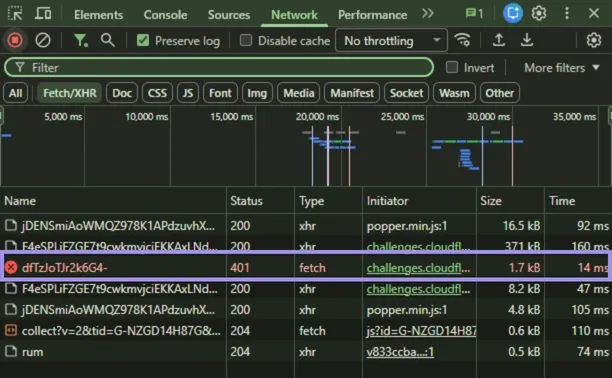
The phrase "success rate" masks a distinction that matters: a request can fail at the proxy or at the target, and the two mean very different things. Often, a proxy-level failure (timeout, reset, or authentication problem) points to the proxy or the route between you and the target, not the destination site.
The HTTP status codes, such as 403, 407, and 504, tell you which: a 407 points back to your proxy auth, while a 403 (your IP is likely flagged) or a 504 (an upstream timeout) comes from the target. The first is a proxy issue, and the second is an IP reputation problem in most situations.
Track two success rates separately. Connection success rate shows whether the proxy connected, authenticated, and returned a response. Target success rate shows whether the destination accepted the request.
A proxy can show a 90% connection rate but less than half that on target success for a defended site, where the IPs connect but get denied. Much of that comes down to proxy IP reputation, which is a separate problem from the proxy itself.
Uptime is the metric that has been inflated the most. The absolute "99.9% uptime" claim usually indicates that the provider gateway is reachable, but not that your endpoints succeed on your targets. A reachable gateway is the bare minimum, not a guarantee that your requests will actually go through and get access to the content you need.
How to design a valid proxy benchmark?
Use the proxy as the only variable between runs. A good benchmark isolates one question, what the proxy adds or costs versus not using it, and everything in the design serves that. Get it wrong: now you are measuring things like variability across the target side, your own network, or time of day.
Measure what matters
A benchmark is only worth running if it mirrors the job you actually do. The closer the test conditions are to your real workload, the more the results will translate to production. If you scrape Amazon US, then test your US proxy pool against Amazon, not a generic speed-test endpoint in another region.
A proxy that wins on a 6KB test page in Germany tells you nothing reliable about how it handles Amazon's defences from a US IP. Pick the target, region, request pattern, and session mode you will use in production, and build the test around those. Designing a test that isn't applicable to your use case just produces clean numbers that don't survive contact with the work.
Controlling variables: baseline, fixed regions, and identical requests
Establish a direct connection control: run your test set with no proxy and write down the numbers. That said, 600ms TTFB doesn't count for anything until you also know the direct connection was 120ms; it's the difference that shows the proxy's cost.
Then hold everything else still. You fix the proxy region across providers you are comparing, query the same target each run, and send an identical request set each time: identical URLs, order, headers and concurrency. As soon as any of these deviates, you no longer have an apples-to-apples comparison.
Environment and tools: hardware, timeouts, and traffic isolation
Your test machine should not become the bottleneck. Avoid running benchmarks on a device with a limited CPU or a saturated connection. If your local connection caps at 50Mbps, you can never measure the true ceiling of a proxy that advertises 50+ Mbps, because your own environment is the limit, not the proxy.
The same applies to CPU: a machine pegged at 100% will add latency that looks like the proxy's fault but isn't. Set explicit timeouts and keep them the same (e.g., if you set a 5-second timeout vs. 30-second timeout on the same proxy, the success rate would be different), and isolate the traffic so that all that exists on the wire is the benchmark.
Use different tools for different stages of the benchmark. For manual checks, our browser-based proxy tester allows you to check the proxies that connect, respond with the location you expect and generally behave as intended before putting them through more rigorous testing when manual checks are required. The other tools cover different parts of the test. Quick checks catch dead proxies, target checks show acceptance problems, and load tools show what happens under pressure.
- Quick health check: FOGLDN Tester is useful for a quick pass/fail health check before you run deeper latency or target-specific tests.
- Ban and reputation check: Run your IPs against a permitted target or test endpoint with ScrapeOps-style checks to see whether the request is being accepted, blocked, or challenged.
- Load testing: k6 scripts concurrent requests and reports the p95 instead of the average.
- Failure analysis: Charles Proxy shows whether an ambiguous failure happened at the proxy or the target, while IPLeak.net confirms the proxy is not leaking your real IP.
Which proxy variables should be tested separately?
Each of these modifies your numbers independently, so only change one at a time.
- Proxy type (residential, ISP, datacenter): Built for different jobs. Datacenter is fast, cheap, but obvious; residential blends in, gets inherited slowly, variable uplinks; ISP sits in the middle. Benchmark each against the job you would actually use it for, since a datacenter proxy will usually come out on top in a latency test and lose in a success-rate test on a defended target.
- Session behaviour (rotating vs sticky): Rotating is a brand new IP per request, and sticky uses one for minutes or more. Stateful work like logging in needs sticky sessions, because a mid-session IP change can invalidate cookies or trigger verification. High-volume scraping of independent pages usually does better with rotation. Also, watch connection reuse. If a sticky session reconnects silently, it can distort your durability results.
- Geographic routing: Run the same test through local and remote endpoints. Lock the region and align it with the location you actually want to target. Most residential networks use regional backconnect entry points, and at the cluster level, a provider's US East and US West gateways will not always perform alike. Use the entry point you will be using and check for route consistency, since a given path may be faster at 2 AM, but it might get congested in peak hours.
- Protocol (HTTP, HTTPS, SOCKS5), usually not a performance variable: To elaborate, protocol choice makes a minor difference in speed when it comes to most proxy benchmarks. The differences between HTTP, HTTPS and SOCKS5 go far beyond performance; they are more about compatibility, authentication and tooling.
- Use the same protocol across tests (the protocol you would actually use in real life) and only compare protocols when your actual workflow relies on that difference.
How to measure proxy performance under load?
A proxy works nicely on a single request, but often falls short at scale, and in production, scale is what counts. This means pushing persistent, concurrent load and measuring four metrics: latency distribution, throughput at saturation, failure clustering, and session duration.
Latency distribution, not one average
A single average latency is the most deceptive number in any benchmark, because averages obscure those slow requests that disrupt workflows. What matters is the distribution: the median (what you typically get), p95 (95% percentile, 95% of requests came back in this much time) and the p99 (your most realistic worst case). A 300ms median can seem stable, but if one in every 20 requests takes over 4 seconds, that tail is what breaks workflows. A single number on the curve is not a benchmark.
Throughput and concurrency
As you add parallel sessions, throughput (requests per second) climbs until it hits a saturation point, the level where more concurrency stops adding throughput and only adds latency and errors. Gradually ramp up step concurrency to locate it. Peak throughput is irrelevant; the relevant factor is how much concurrency the proxy will support before errors shoot up.
Reliability and failure analysis
Failures tend to come in clusters when under load, so record the type of each. Separate timeouts and connection resets from full bans. If 429s or 403s rise as concurrency increases, the target may be reacting to request volume rather than the proxy failing.
If those bans dominate, the fix is in how you reduce proxy bans, not in the benchmark itself. Track retry rate as well. When a proxy can only successfully return the payload at the third attempt, it is still wasting time and bandwidth.
Session durability
Lastly, track how long sessions remain usable. Monitor for rapid IP rotation, throughput degradation, and growing error rates across time. The more granular durability tests like these are closer to the gold standard for residential pools because exit nodes can dramatically impact availability, and this is of most importance with residential proxies as the underlying network becomes less uniform.
How to interpret benchmark results?
A synthetic test can only predict production to the extent that it resembles your actual workload. The numbers tell you how a proxy performed on that test; they don't tell you whether it will work for your particular use case, so the closer your test is to real usage, the better the results translate. Even with a proxy which does well versus another endpoint, your workflow can be different, and it may fail.
Signal vs noise
It is not always the proxy at fault for slow or failed requests. The target may simply be slow, which your baseline reveals: if the direct request is slow as well, then the proxy is in the clear. Another source is anti-bot friction like 403s and CAPTCHA, the result of proxy detection techniques, in which case IP reputation rather than plain speed becomes the measure. On top of that, internet variability adds its jitter.
Repetition is the answer: perform across different hours, consider the consistent pattern as a signal and spikes as noise. The larger your dataset, the easier this separation becomes, since a handful of requests can be skewed by a single bad moment, while thousands of requests across time let the real pattern surface and average the noise out.
Practical decision criteria
Before looking at the numbers, decide what “good enough” means for the workflow. When it comes to scraping, the success rate usually matters more than raw speed. When it comes to automation and account workflows, session durability and stability are generally more important than throughput; those tasks rise or fall based on whether they pinpoint the right location.
In the cases of undefended targets where speed is everything, datacenter proxies are most often the answer, even with their much lower trust signal.
Fair provider comparisons
Two providers are comparable only when the test around them is identical, with an identical plan tier, region, session mode and workload. Change any of those, and you are comparing the conditions, not the providers. Which is also why vendor-published benchmarks should be treated with caution: they do not always disclose their test conditions.
Limits of proxy benchmarking
A benchmark only captures a moment in time, so the numbers you get are best treated as an estimate that goes stale, not a final verdict on the proxy.
External variability
Outside your control is the biggest limit: the target. Sites are throttled both on load and based on how much they have seen your IPs already, so you can post different numbers with the same proxy an hour apart. Defences also change; this is why the Wisconsin Proxy Benchmark, one of the earliest formal efforts in this space, was explicit about what its own method did not model. Being clear about what a benchmark does not cover actually makes it more useful, since you know where to look beyond it.
Practical workarounds
There is nothing you can do to eliminate this variability, but at least with some effort and practice, you can keep it from skewing your results. Run all times of the day and across days so that time-of-day effects average out. Group targets by type (defended versus open, per region) and report per group in case a blended average obscures more than it reveals.
Don’t report means, report percentiles, and document your conditions with each result, like date, region, plan, timeout and concurrency. None of this matters if your IPs are sourced badly, and ethical proxy sourcing is what separates a trustworthy pool from a problem one.